An Analysis of Job Creation and Community Benefits from Green Investments
This report analyzes the potential job creation and quality of life benefits from investing in clean transportation, sustainable development, clean energy, energy efficiency, and natural resource conservation in Massachusetts. These investments are found to create significantly more jobs per dollar than the state’s overall economy, as well as the state’s ten largest industries. Additionally, the investments return over two dollars in cost savings, time savings, and health benefits for every dollar invested. These findings can be re-weighted to project the potential jobs and community benefits from future spending packages in the Commonwealth.
Interested in applying our analyses to programs outside the Green Investment Portfolio?
LEARN MORE
All findings in the Investing in a Better Massachusetts: An Analysis of Job Creation and Community Benefit of Green Investments can be scaled linearly using the million dollar multipliers. These multipliers can be used to project the jobs and community benefits of any future public investment scenarios, including combinations of multiple programs or investment areas. Climate XChange can also provide custom policy analysis and investment results for additional green investments or proposed spending packages in Massachusetts that align with Green Investments. We can model job creation, provide occupational analysis, and/or analyze the economic, public health, and climate benefits from a custom portfolio of Green Investment programs and projects, or new, additional investment programs for Massachusetts that were beyond the scope of this report. Specific analyses that are independent of investment programs, such as the public health damages of fossil fuel combustion in the state, can also be provided upon request.
Contact the report authors Ruby Wincele (rwincele@climate-xchange.org) and Jonah Kurman-Faber (jonah@climate-xchange.org) with more information about your request.
Watch Investing in a Better Massachusetts authors talk about their research and answer questions about the report
Building a Green Investment Portfolio for Massachusetts
This study is motivated by the urgent need to create new economic prosperity and community well-being in Massachusetts. To meet this challenge, Climate XChange Education and Research, Inc. analyzed the economic and health impacts of 18 different conceptual investment programs. The programs were analyzed for their job creation, wage and salary levels, and occupational characteristics using IMPLAN economic modeling. They were subsequently evaluated for cost savings, public health improvements, and climate benefits using peer-reviewed and open source modeling tools.1
Based on this analysis, an effective strategy for economic and community development in Massachusetts prioritizes public programs in clean transportation, sustainable development, renewable energy, energy efficiency, grid modernization, conservation, and natural resources. These programs, which this report collectively refers to as Green Investments, provide robust job creation, as well as significant economic and social benefits that outweigh any upfront costs. The programs will also support the jobs, services, and industries that will help Massachusetts prosper in the transition towards a net zero emissions future.2
Key Findings
Jobs Potential of Green Investments
The Green Investment Portfolio supports nearly twice as many jobs per dollar than the state’s ten largest industries.3 The investments also support 65 percent more jobs per dollar than the state’s overall economy.
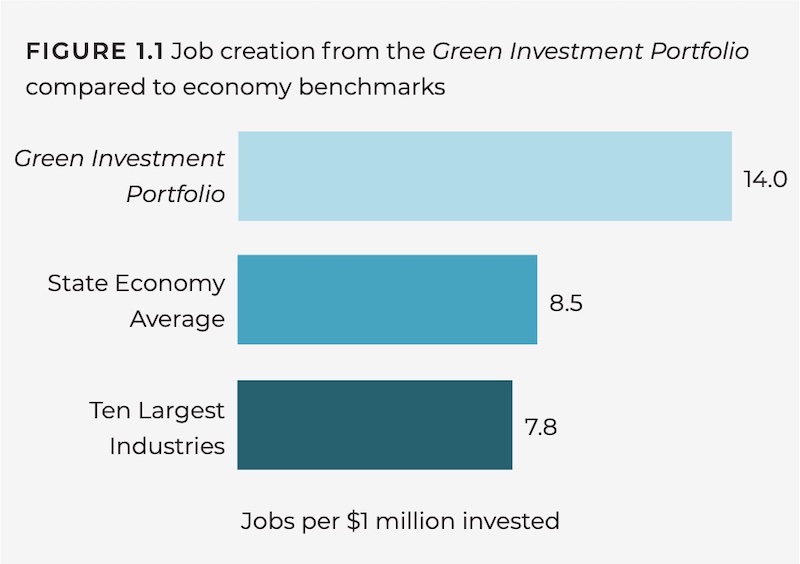
The job potential of all 18 Green Investments ranges from 5.7 to 28.8 jobs created per million dollars invested. These jobs cut across many different industries and occupations, with particularly strong job creation in construction, architecture and engineering services, and health and family services.
Green Investments outperform other benchmarks on job creation because they support labor-intensive productive businesses that keep dollars local and in the hands of working residents. Upfront jobs created from the Green Investment Portfolio pay an average median salary of $73,174, but span a vast range of pay and benefits.
The portfolio outperforms the state average for job creation on direct impacts alone. In addition, these investments also create long-term cost savings for households, businesses, and institutions by reducing reliance on out-of-state energy. Massachusetts currently spends over $17 billion per year importing fossil fuels, and a dollar saved on fossil fuel consumption is more likely to be spent locally.4 When these energy savings are captured in the model, the jobs potential of the Green Investment Portfolio increases to nearly twice that of the state’s ten largest industries.
Community Benefits of Green Investments
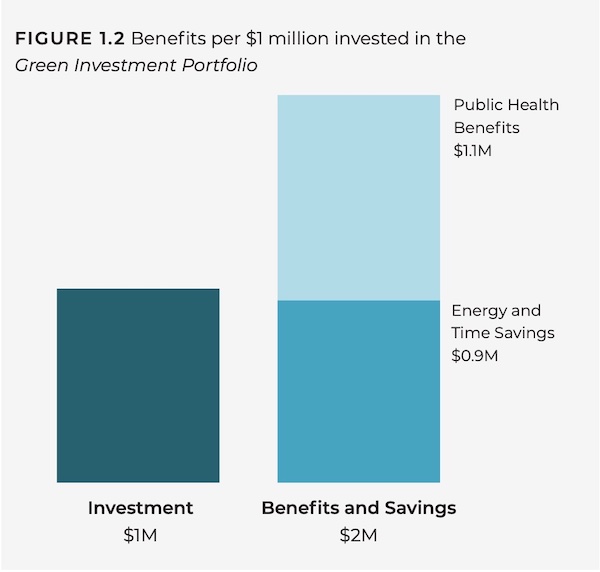
Beyond job creation, Green Investments result in significant cost savings and public health benefits. These investments reduce fossil fuel imports and make the state’s infrastructure systems more efficient, while removing harmful pollutants from the air residents breathe. Every dollar invested in the Green Investment Portfolio returns over two dollars in cost savings and public health benefits. These benefits include consumer and business savings on utilities, reduced traffic congestion, public health benefits from cleaner air, and safer and healthier transportation systems.
Next Steps for Policymakers
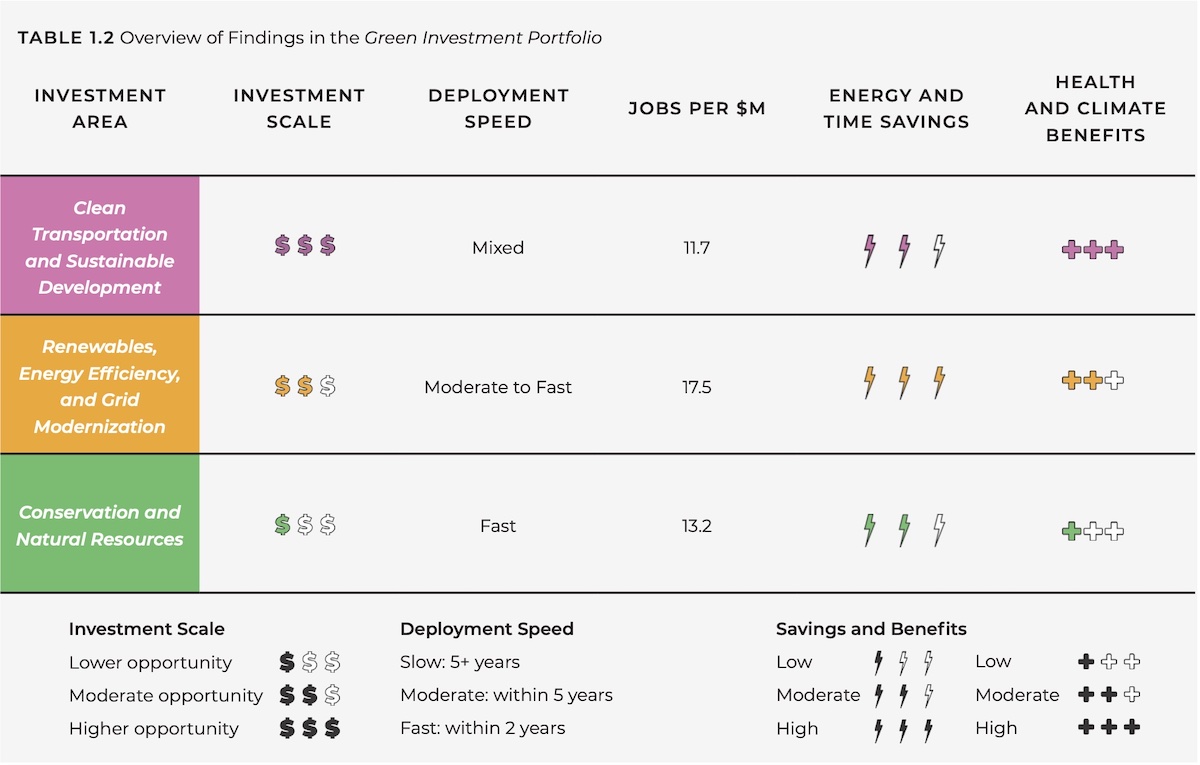
The findings in this report are presented as comparative “multipliers,” which normalize all benefits to a million dollar investment. To complement these findings, two additional factors are layered in: investment scale and deployment speed (see Table 1.2). Investment scale refers to the size of funding required to exhaust available investment opportunities from the Green Investment Portfolio, whereas deployment speed refers to the pace at which projects can reasonably be scoped, planned, and implemented.
Program Profiles
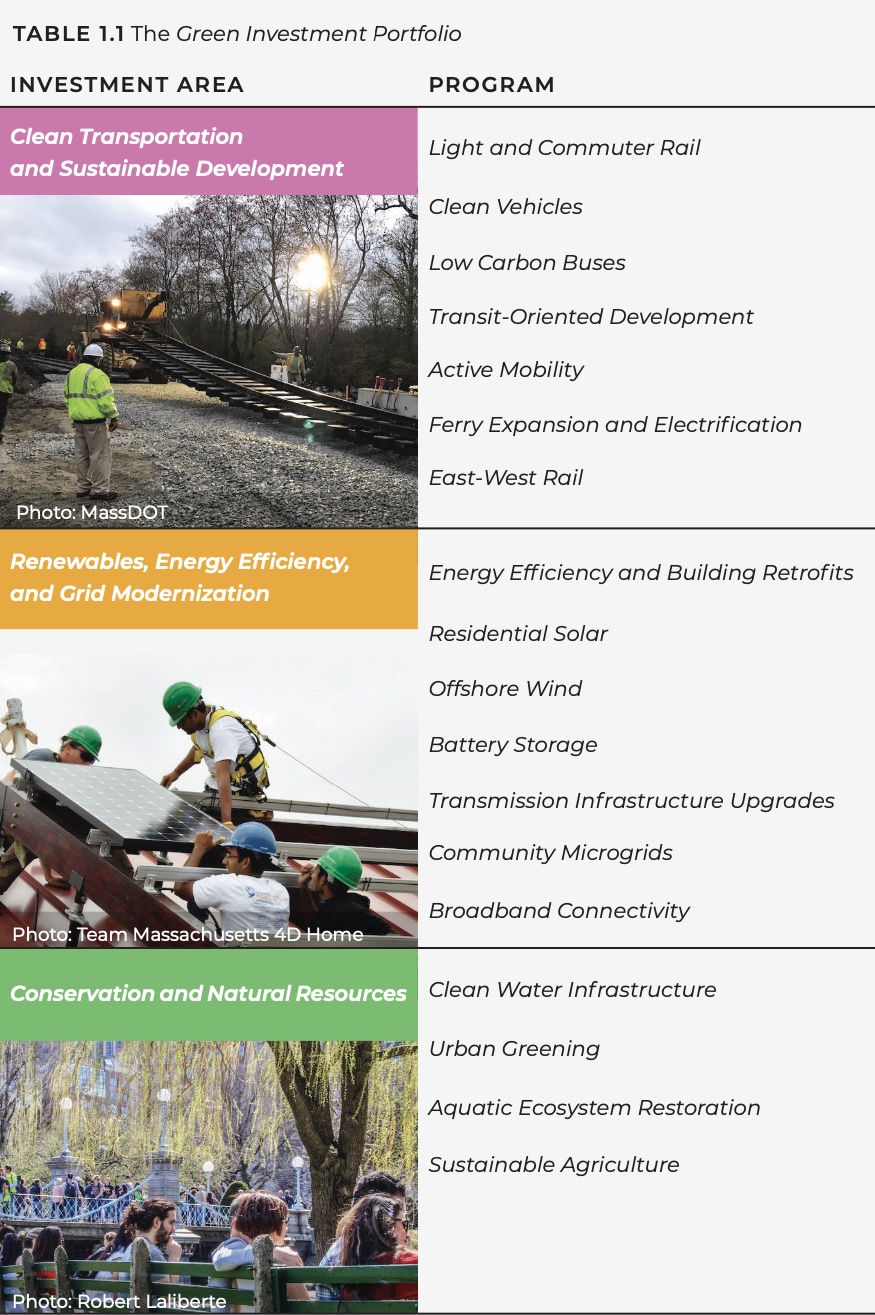
This study’s data is packaged into three “investment areas”, each of which contains four to seven individual programs. The programs are grouped into investment areas based on which sector of the economy the program predominantly focuses on: transportation and housing, buildings and electricity, and natural resources.
This section provides more detailed model results for each program and investment area in a standard one-page template. Each one-pager includes:
- An explanation of the investment area or program
- The investment scale and deployment speed
- Job creation potential, in comparison to the state’s ten largest industries
- The top five occupations supported by the investment area or program
- The measurable energy cost savings, travel time savings, air quality benefits, physical activity benefits, traffic accidents avoided, and climate benefits
The program profile findings are presented as a one million dollar multiplier, which can be scaled linearly. For example, a two million dollar investment into a given program would create twice the jobs and community benefits as listed on its program profile page. These multipliers can be used to project the jobs and community benefits of any future public investment scenarios, including combinations of multiple programs or investment areas.
Clean Transportation and Sustainable Development
![]()
Clean Transportation and Sustainable Development
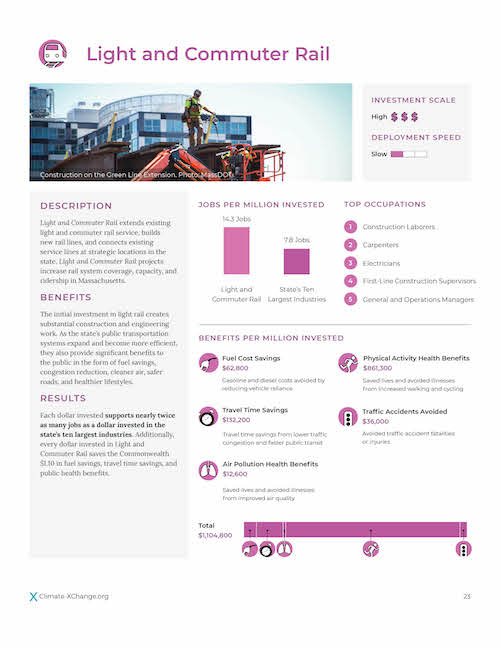
Light and Commuter Rail
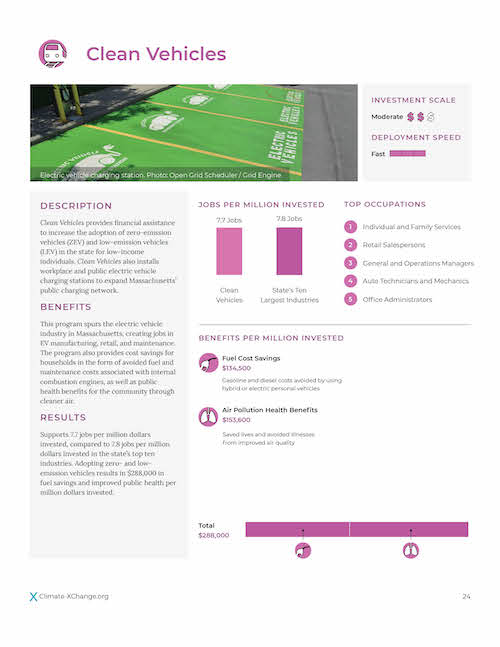
Clean Vehicles
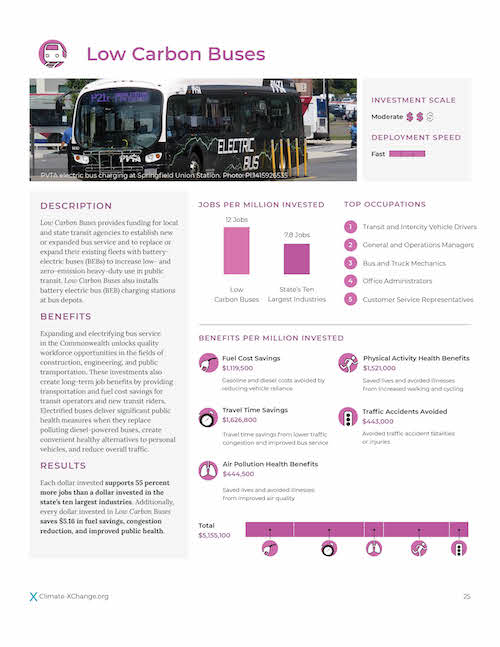
Low Carbon Buses
![]()
Transit-Oriented Development
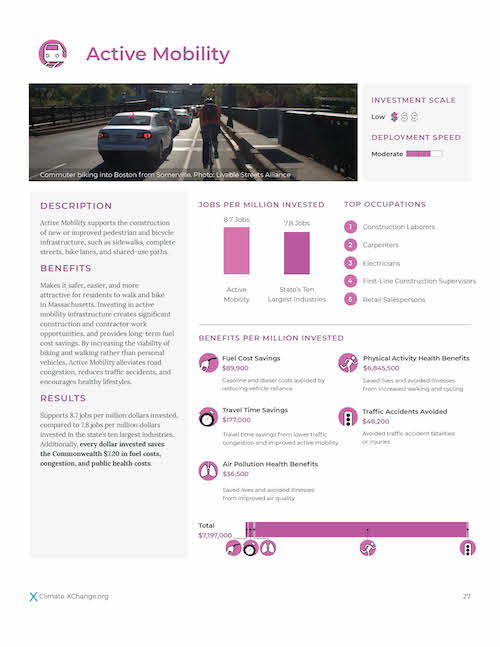
Active Mobility
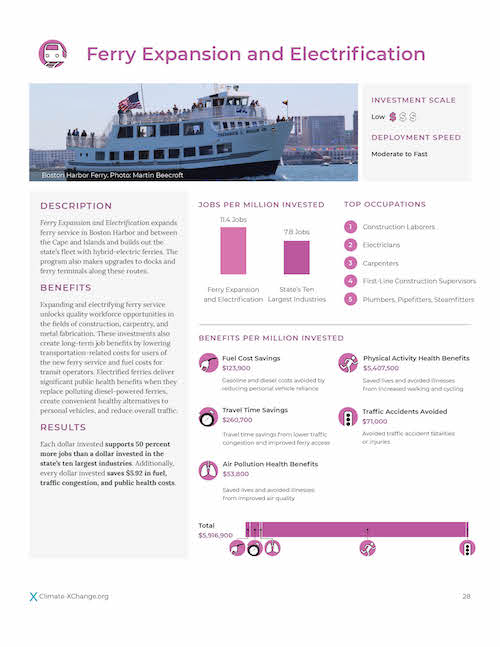
Ferry Expansion and Electrification
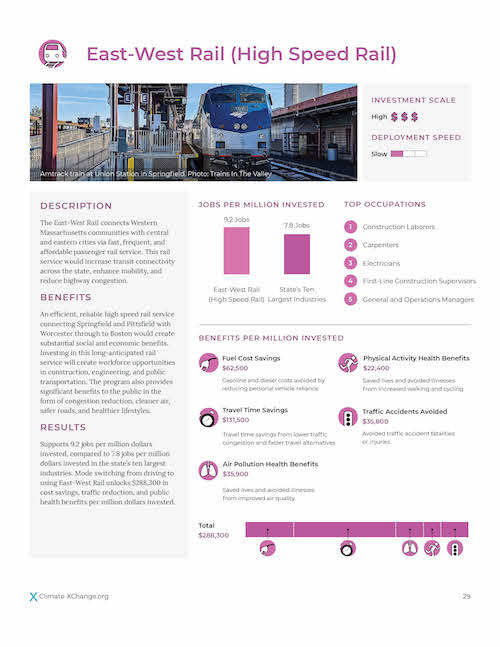
East-West Rail
Renewables, Energy Efficiency, and Grid Modernization
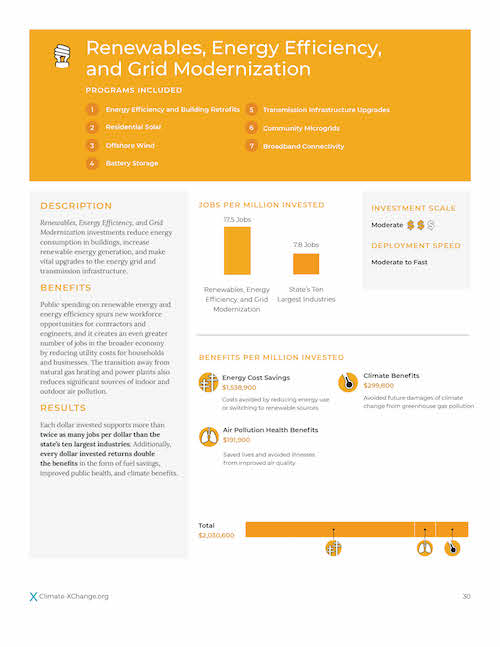
Renewables, Energy Efficiency, and Grid Modernization
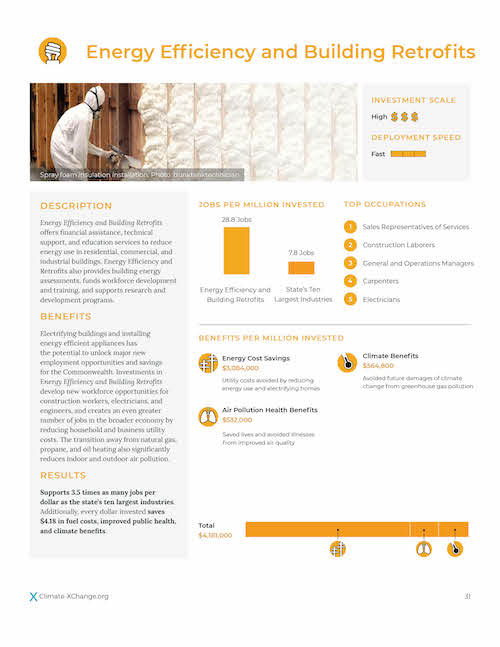
Energy Efficiency and Building Retrofits
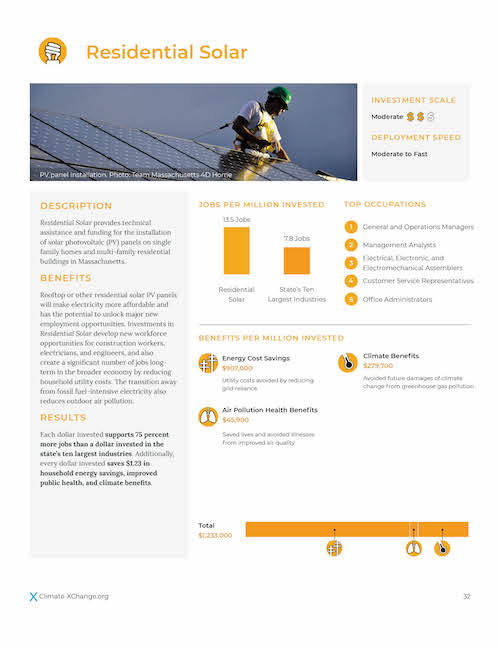
Residential Solar
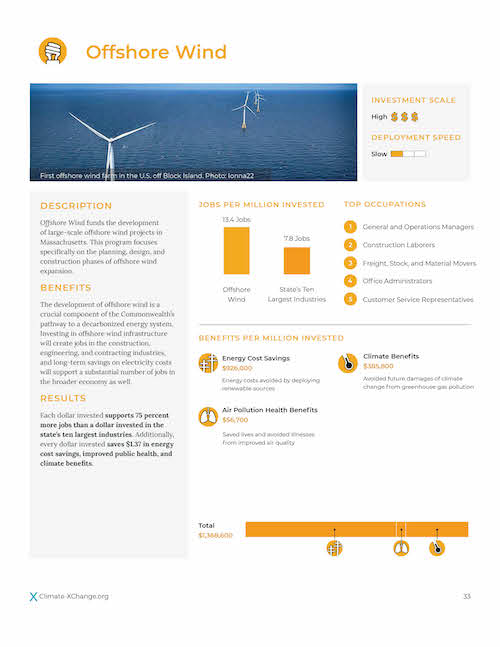
Offshore Wind
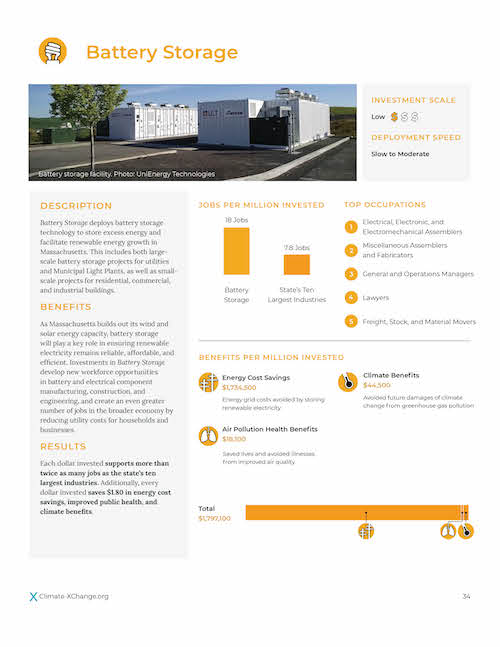
Battery Storage
![]()
Transmission Infrastructure
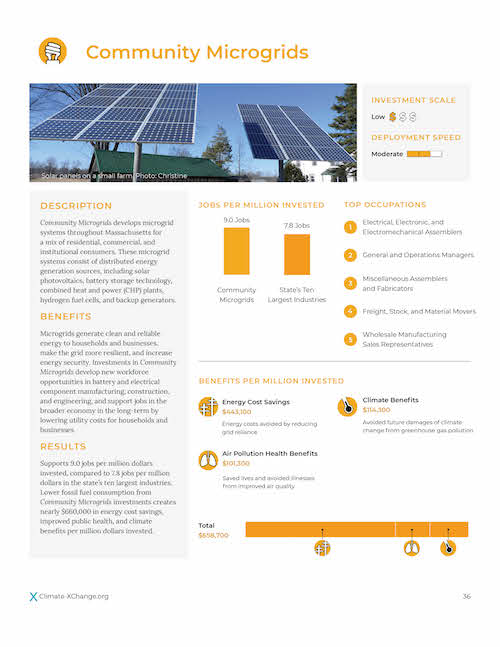
Community Microgrids
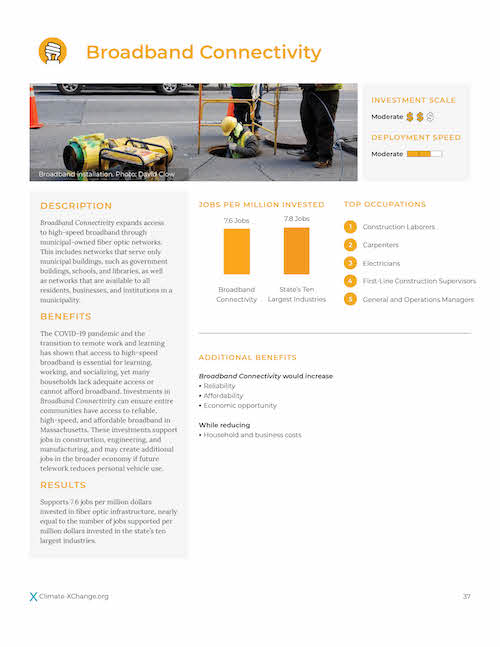
Broadband Connectivity
Conservation and Natural Resources
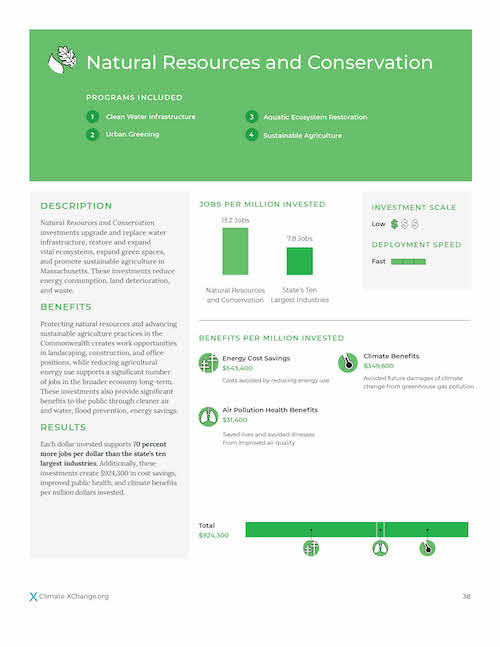
Conservation and Natural Resources
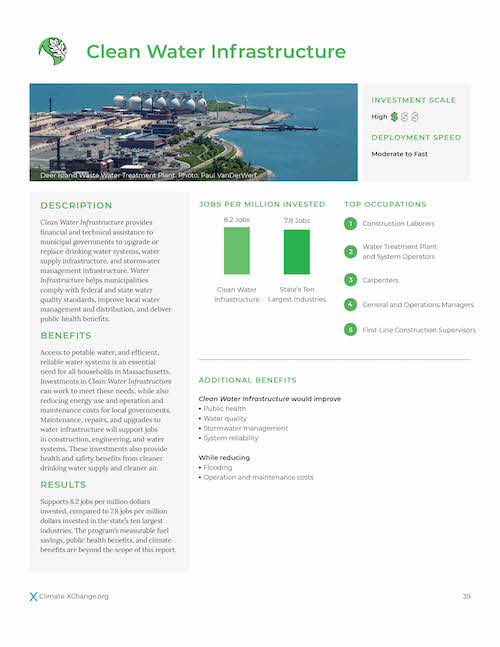
Clean Water Infrastructure
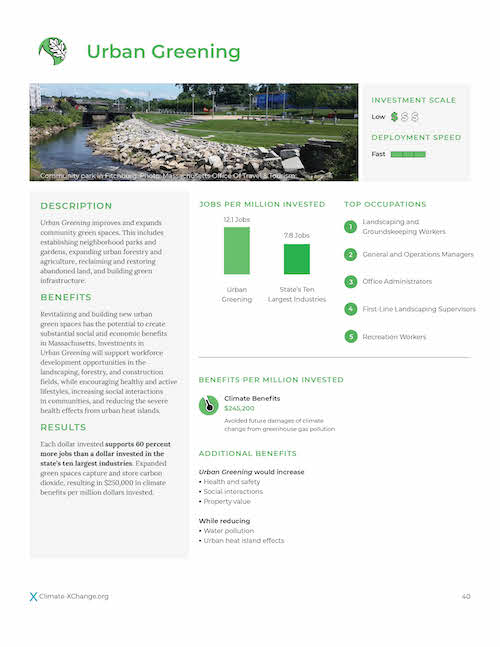
Urban Greening
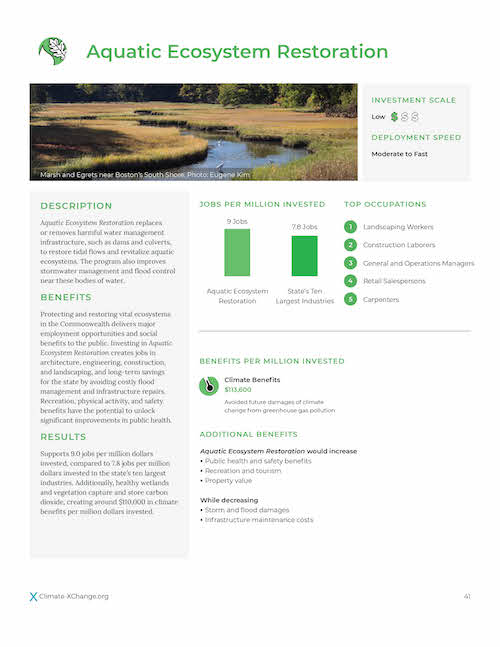
Aquatic Ecosystem Restoration
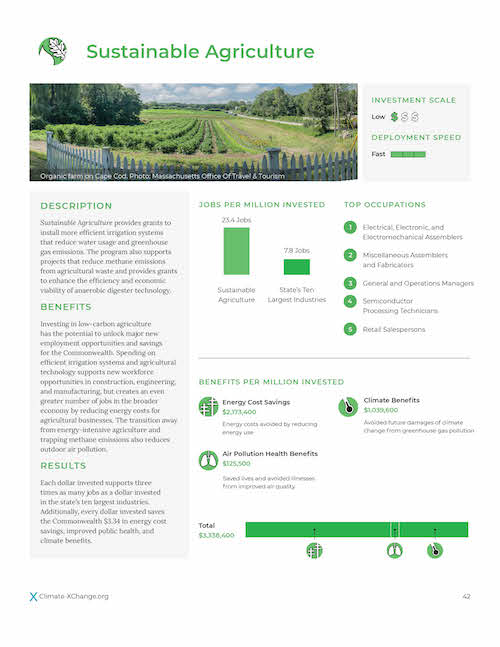
Sustainable Agriculture
Footnotes
1. More details on the models used in this study can be found in the Technical Appendix.
2. As required by SB.9, An Act Creating a Next-Generation Roadmap for Massachusetts Climate Policy.
3. Industry size is defined as the sum of the industry’s economic output. In order of size, the ten largest industries in Massachusetts are Scientific research and development services; Hospitals; Other real estate; Other financial investment activities; Monetary authorities and depository credit intermediation; Insurance carriers; Management of companies and enterprises; Tenant-occupied housing; Software publishers; and Custom computer programming services.
4. U.S. Energy Information Administration, “State Energy Profile: Massachusetts.” April 2021 https://www.eia.gov/state/data.php?sid=MA#ConsumptionExpenditures