*This article was originally published by our friends at Carbon Washington, for more information please visit their website.

Initiative 1631, is the latest iteration of carbon pricing to come to Washington State. It was filed by a coalition including the Alliance for Jobs and Clean Energy, The Nature Conservancy, and a number of Washington’s Tribal nations. The following analysis looks at features of the ballot initiative in comparison to the recent legislative carbon tax proposal (SB 6203) that passed out of two senate committees and Carbon Washington’s 2016 carbon tax initiative (I-732). This analysis compares their ability to reduce emissions and offset any disproportionate impacts of pricing carbon, leaving discussion of political strategy and the use of other investments (like forests/water/rural economic development) to future blog posts.
This analysis is not meant to be an endorsement of the initiative or to suggest opposition to it.
Carbon Price
I-1631 is different from the other two approaches in that it is structured as a ‘fee’, rather than a ‘tax.’ A fee has the political benefit of avoiding the dreaded “t” word — tax. More importantly, a ‘fee’ legal structure limits the uses of revenue from the policy to addressing carbon/pollution issues, not broader issues like rural economic development (as in 6203) or tax reform (as in I-732). However, from a pricing perspective, the difference between a fee and tax is not so important.
Initiative 1631 begins at $15 per ton starting in 2020. The price rises $2 per ton, per year, plus inflation. In 2035, the price will be about $40 per ton (in today’s dollars) and will either freeze or continue to rise, depending on whether the state is on track to meet its statutory greenhouse gas targets. The Department of Ecology recommends making these targets more stringent, and a bill to do so passed the House of Representatives this year, but stalled in the Senate.
To put I-1631’s price in perspective, in 2035 the carbon price would be stronger than SB 6203’s (which capped its price at $30 per ton) and reasonably close to I-732’s (which would rise at 3.5% per year plus inflation until it reached $100).
All current Washington state carbon tax proposals lag behind British Columbia, whose carbon tax rate will be climbing to $50 (in Canadian dollars) per ton by 2021. The graph below compares the carbon price trajectory of I-1631 with SB 6203 and I-732.

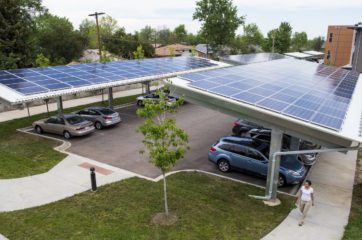
Clean Energy Investments
Initiative 732 relied entirely on a strong price signal to generate carbon reductions, while both SB 6203 and I-1631 use price signals combined with investments to reduce emissions.
The carbon reduction and clean air investments in I-1631 account for 70% of the total revenue allocation (larger than the 50% allocation in SB 6203). But, within the 70% carbon reduction bucket are sub-buckets related to workers and low-income support (more on that in the following sections), so not all of these funds will go toward carbon reduction. Using carbon pricing revenue to fund carbon reduction projects can generate more reductions than the price would alone, either by making investments at costs above the price signal or by making investments in areas where the carbon price doesn’t apply (like EITE businesses or carbon sequestration — more on this at the very end of this blog). The investments allowed in I-1631 are “technology neutral” and could cover anything from pumped hydroelectric energy storage, through electric buses or energy efficiency, to any projects that “yield or facilitate verifiable reductions in pollution.”
I-1631’s approach differs in a few key ways from SB 6203. The word ‘facilitates’ is more flexible language that could allow projects that indirectly reduce pollution to qualify. SB 6203 earmarked a certain percentage for ‘multi-modal’ transportation investments, while I-1631 does not. In both approaches, the pairing of clean-energy spending with carbon pricing creates a risk that the investments may fund projects where the price itself is sufficient to motivate the project’s execution. Ideally, investments should generate new reductions beyond those existing policies will generate. This is also referred to as ‘additionality.’ The Stockholm Environmental Institute has summarized the challenge facing policymakers:
“Second, a major challenge when funding mitigation in conjunction with a carbon tax can be differentiating between activities that are already motivated by the tax, and those that truly need additional investment in order to be viable. With a carbon tax of $15–25/tonne of CO2, for example, many kinds of clean energy projects may be economically viable without additional financial support, so developers will pursue them without further revenue or incentives. Funding these activities with carbon tax revenues would not generate additional GHG reductions, but simply transfer wealth to the developers by increasing their profit margins.”
Both I-1631 and SB 6203 include language that attempts to prioritize additionality in selecting investments. That may be challenging in practice. California’s experience can be instructive, where investments have ranged in cost from $5 per ton to $117 per ton (more on that here on page xiv).


Both I-1631 and SB 6203 also provide for utility retained revenue. This would allow utilities to reclaim up to 100% of the carbon tax paid by their customers if they spend the revenue on a carbon reduction plan approved by the Utilities and Transportation Commission (for private utilities) or the Department of Commerce (for public utilities). We have voiced concerns about 100% revenue retention; if utilities can keep all the fees generated from natural gas and coal plants, this may reduce the urgency of transitioning to cleaner sources of power.
To address this concern, SB 6203 included a requirement that reduction plans for investor-owned utilities “must eliminate, to the extent feasible and at a reasonable cost, any tax obligation imposed by this act associated with electricity by 2050.” That means the utilities would have to get rid of all their carbon generation by 2050 (within reason and feasibility boundaries). The sponsors of I-1631 included a similar but less stringent provision, requiring electric utility plans to include “a long-term strategy to eliminate any fee obligation” imposed by the measure, as a way to push utilities to use at least some of the retained revenue to directly reduce carbon from their electricity generating sources.
Energy-Intensive, Trade-Exposed Businesses
A sticking point for every carbon pricing proposal has been the treatment of energy-intensive, trade-exposed businesses, or “EITEs”. EITEs, like aluminum and steel makers, use a lot of energy and trade on global markets against competitors in places without carbon pricing. There is a consensus that we do not want to raise the energy costs on these businesses so that they leave the state, taking jobs and their pollution with them. The ideal fix to this issue is a border adjustment tax (or tariff) on imported competing goods that have not had to pay for their carbon emissions, but states may lack the legal authority to take that approach. Most of Washington’s emissions come from transportation and electricity, not EITEs, but complex questions remain around who should qualify as an EITE and how to ensure these industries still pull their carbon weight.
I-1631 piggybacks on the work done through the Clean Air Rule (CAR) to identify EITEs and exempts a number of businesses that the CAR rule identified. The Department of Commerce can develop criteria that will allow additional businesses to qualify for an exemption should new EITE industries emerge. Exempt businesses may also apply for carbon-reduction grants to reduce onsite emissions.
I-1631 explicitly exempts 23 business classes, landing between SB 6203, which exempted 55 business classes based on NAICS codes, and I-732 which did not offer any business exemptions. Instead, I-732 effectively eliminated B&O taxes on manufacturers in an attempt to indirectly offset an increase in energy costs. This “tax swap” approach is more likely to generate emission reductions from industrial sectors because it keeps the price signal in place, compared to an exemption approach that mostly lets EITEs off the hook. However, the B&O tax rebate model was criticized for offering some businesses too much in trying to offset their increased energy costs (like Boeing) and others too little (like cement producers). The trade-offs of this approach are discussed here.
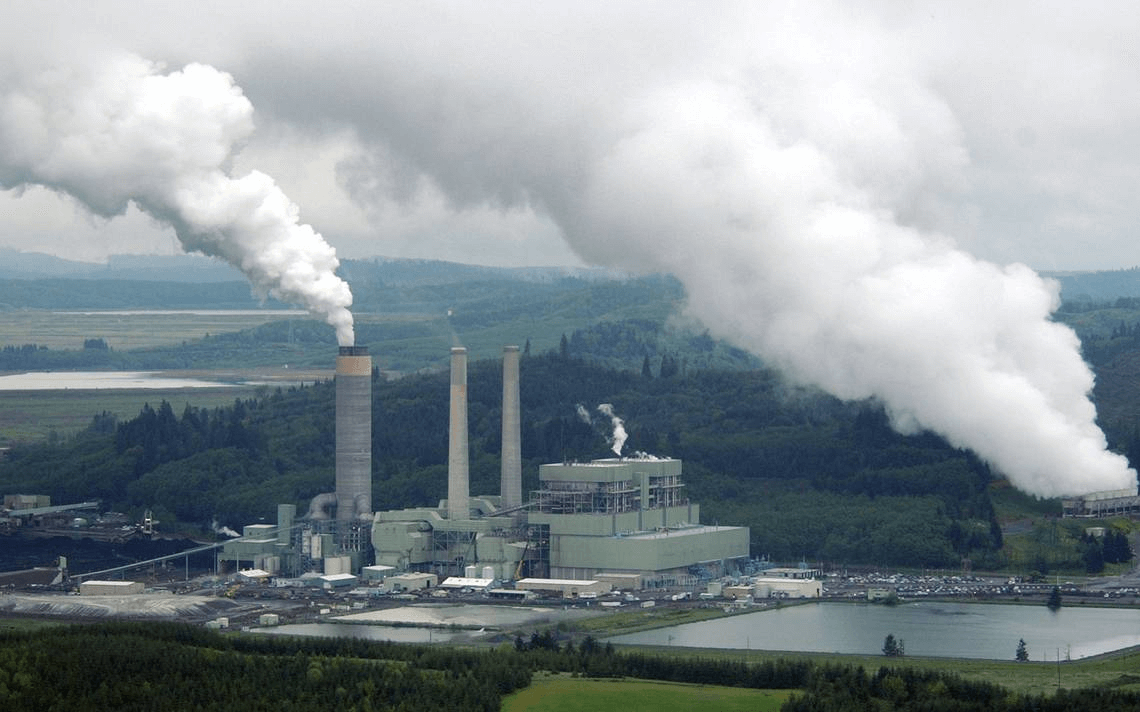
Coal
I-1631 includes an exemption for a “coal closure facility” that “is legally bound to cease operation by December 31, 2025.” This will apply to Washington’s only coal plant, located in Centralia. An agreement between the plant’s owners, some environmental groups, and Governor Gregoire mandated shutdown of the plant by 2025 in exchange for regulatory certainty in the interim. One element of the agreement was the preemption of future regulations on the Centralia plant including any “greenhouse gas emission performance standard, or other operating or financial requirement or limitation relating to greenhouse gas emissions.” There is some debate as to whether this limitation applies to the legislature and initiative drafters. However, SB 6203 and I-1631 have chosen to exempt the Centralia plant. This exemption opens up two challenging questions:
Does the coal exemption create a perverse incentive? We (and others) have voiced concerns that taxing natural gas, but not taxing coal, could make coal a relatively cheaper source of electricity despite its heavier carbon footprint. The Centralia plant has been running at less than 50% capacity; it could ramp up to a higher level if its power becomes cheaper than gas, resulting in increased carbon emissions (you can read more about this in Crosscut). I-732 did not offer an exemption to the Centralia plant and we voiced concern about the exemption to legislators during the SB 6203 discussions. We estimated that if the plan ramped up to full capacity, it would reduce the total effectiveness of SB 6203 by about half in the short term. However, it’s worth acknowledging that this is a risk, not a certainty. With variance in the price of natural gas, and half the Centralia plant shutting down in 2020 anyway (when I-1631 begins) it is possible that this coal exemption won’t end up being such a big deal.
What about the U.S. Constitution? A secondary risk surrounding the coal exemption would be a Dormant Commerce Clause legal challenge alleging that the exemption favors in-state coal plants over out-of-state plants. This issue has been hotly debated in relation to environmental and energy policies in other states, and we flagged it as a potential risk in SB 6203. I-1631 appears to address this threat head-on by exempting any coal plant with planned shutdown before 2025. In practice, this likely means extending the exemption to Puget Sound Energy’s ownership share of Colstrip Units 1&2 in Montana, which ship electricity to Washington and are slated to shut down in 2022. We aren’t sure whether other plants, owned by PacifiCorp, could be included as well. Taken together, the Colstrip and Centralia exemptions represent roughly 9% of Washington State’s total emissions, which were 94.4 million MT CO2 in 2013. However, the share of coal emissions exempt will be reduced to zero as the coal plants shut down.

Is this really worth worrying about? We had the chance to discuss this matter with one of the authors of the 2011 Centralia shutdown agreement. We were reminded that the deal resulted in many benefits not directly related to climate change (like mercury controls on the plants) and that the state achieved certainty that one of the biggest polluters in the west will eventually shut down. The author argued that the lower price figure and later starting dates of SB 6203 and I-1631 would be less likely to create a perverse incentive — and that in the long run, the exemptions are just a 5-year hiccup in what is a multi-decade climate fight.
Low-Income Households, Workers & Equity
A good carbon pricing policy ought to include provisions that ensure low-income households are not overly burdened by energy costs. However, a debate remains around how best to accomplish that goal and whether carbon pricing policy must also be tasked with addressing broader social and environmental challenges (like other pollution problems, worker displacement, economic inequality, etc.). I-732, SB 6203, and I-1631 answer these questions differently and make different trade-offs regarding how the burdens and benefits are distributed within society.
I-732 offset the impact of the carbon tax on low-income households in the simplest way of the three approaches. A sales tax reduction of one percentage point would reach all low-income people in the state regardless of their situation, including the homeless and undocumented workers, but the benefit would vary based on the spending of each individual. Roughly half of all low-income households would also have qualified to receive a state bump-up to the Earned Income Tax Credit of up to $1500 per household. Taken together, these reforms would have been the most progressive change to the Washington tax code in decades. The I-732 approach would have achieved broad financial shielding, and made some progress on economic inequality, but by design it didn’t address other issues related to pollution, workers and environmental justice. This was the subject of much controversy around the initiative (see here and here for more on that).
SB 6203 included a car tab reduction of $40-$60 for low-income households. Utilities retaining revenue were also required to spend 20% of their revenue on programs to benefit low-income households. Finally, carbon reduction grants that benefited low-income communities or “health action areas” were prioritized, if all other criteria (like the efficiency of the investments) were equal. Taken together, it was likely (but not certain) that most low-income households would be financially shielded. SB 6203 addressed transition job losses by offering up to two years of pension protection and worker retraining for union and non-union fossil fuel workers. The SB 6203 approach mostly achieved financial shielding and offered to make modest progress on broader equity issues.
I-1631 does not include a low-income rebate or a car tab reduction (likely due to the legal limitations of a fee) and instead relies on public investments to benefit low-income households. First, 15% of both the clean energy fund and utility retained revenue must be used to “prevent or eliminate the increased energy burden of people with lower incomes.” In addition, I-1631 requires that 35% of all funds provide “direct and meaningful” benefits to “pollution and health action areas” — regions where residents face a significant cumulative environmental health impact as measured by income, pollution and other challenges. This approach is used in California, but an analysis by the Sightline Institute suggested that it might not work as well in Oregon — which may be instructive for Washington, as well. The Front and Centered Coalition has already begun spearheading a California-style mapping process for Washington.
The worker transition support in I-1631 takes a similar but more generous approach than SB 6203, setting aside $50 million to provide full pension, salary, and health benefits to fossil fuel workers who lose their jobs.
The I-1631 approach makes a tradeoff that favors addressing equity issues related to environmental justice and historic under-investment, at the expense of ensuring broad financial shielding. Some low-income households would notice benefits through utility programs to reduce ‘energy burden’ (like weatherization or bill assistance) and public investments (like new transit) that occur within their community. There is a risk that others may slip through the cracks. I-1631 addresses this by aiming for “100% enrollment” in low-income programs, but there remains uncertainty as to how expensive or feasible it will be to achieve that (one recent study explores this). In sum, I-1631 allocates the largest share of revenue to low-income and equity priorities (35%), but between enrollment, geography, and overhead costs, there is less clarity as to how the average low-income household would be impacted.
Draft Health Action Area Map

Oversight and Accountability
I-732
- The Department of Revenue was in charge of implementing the carbon tax and accompanying tax reductions. No new oversight panels or boards would be created. The only required reporting concerned the financial performance of the tax swap.
SB 6203
- Oversight Committee: A joint committee would be created to oversee the program, made up of public officials including the Governor, Commissioner of Public Lands, Treasurer, and a Senator and Representative from each party.
- Department of Commerce reporting: The Department of Commerce would be required to submit reports to the oversight panel annually that include audits of the funds spent, assessments of efficiency and effectiveness, and any recommended changes to the program. The department would also be required to solicit independent audits.
I-1631
- Oversight board: An oversight board would be created, chaired by a new full-time staff person within the Governor’s office. The board would have 15 members, appointed by the Governor to four-year terms, and would not consist of elected officials (aside from the Commissioner of Public Lands). Members would include one tribal representative, one representative of vulnerable populations/health action areas, and the six co-chairs of the panels outlined below.
- Advisory panels: Three additional advisory panels would be created, appointed by the Governor to four-year terms, with a third of all members representing vulnerable populations/health action areas. One panel would advise on clean air/clean energy programs, another on healthy forests/clean water programs, and the last panel would advise on environmental and economic justice programs. The panels, in conjunction with state agencies, would develop evaluation criteria and make funding recommendations to the board. Each panel would have specific membership requirements, including business, labor, and tribal interests. The panelists would be compensated.
- Other Reporting: The Department of Commerce would be required to prepare a report to the board every four years on the effectiveness of the investments.
Comparing Carbon Reductions
We are regularly asked, “How much carbon would each policy reduce?” This is a challenging question to answer. The Washington Business Alliance has modeled some of these approaches (I-732, SB 6203’s first draft) but there is inherent uncertainty that comes with modeling carbon pricing. We find that each of the three policies would be effective at reducing carbon, and the real questions surround tradeoffs of efficiency, fairness, and political strategy.
That being said, we can offer our best ‘guess’ about how to rank these approaches. Keep in mind that our ‘guess’ is based on our own reasoning, not empirical modeling.
Before we reveal our ‘guesses,’ here’s some background about carbon pricing and market failures that informs our thinking.
Background
Climate policy hawks generally like carbon pricing for three reasons:
- It solves the largest market failure driving climate change by forcing polluters to bear a direct cost for their activity instead of imposing it on society.
- Carbon pricing achieves emission reductions at the lowest overall cost to society (i.e., it is economically efficient).
- A carbon price harnesses market forces to motivate all consumers of fossil energy to reduce their emissions.
However, the effectiveness of a given carbon pricing policy will depend on the strength of the price signal, the breadth of the economy it covers, and how well any spending programs or other complementary features solve additional market failures that a price alone does not address.
A few examples of those other market failures include:
- Split incentives — e.g., landlords pay upfront costs while renters pay operating costs.
- Circular dependencies — e.g., electric vehicles need charging stations and vice versa.
- High upfront costs and long payback periods, which can limit accessibility for low-income households and small businesses — e.g., a more efficient car or appliance can cost more to buy, even though it has a lower total cost of ownership over time.
- Structural impediments to commercializing innovations — e.g., lack of private capital, valley of death, long development cycles.
- Carbon sequestration — price alone will not reward or incentivize the capture and long-term storage of carbon.
Policy effectiveness also depends on external factors such as: how strongly consumers respond to the carbon price, the pace of technology innovation and cost declines, population growth, and the overall trajectory of the economy.
And now, for our best ‘guess’…
Short Term (2018 – 2030)
In the short term, I-732 would likely sprint ahead of the other two policies, because it has both the strongest price signal and the broadest coverage (fewest exemptions). I-732’s higher starting price will motivate consumers to act sooner and more boldly. This is particularly important because climate change is cumulative and there is a time lag between emissions and impacts; therefore an earlier reduction is worth more than a later one of the same magnitude. I-732 would also drive down emissions in sectors like manufacturing and air/marine transport that are exempt under the other policies. Furthermore, the coal exemptions in SB 6203 and I-1631 create uncertainty around perverse incentives and could reduce the total effectiveness of the policy in the short run. Another factor is that the spending programs in SB 6203 and I-1631 will take some time to start generating reductions as they go through the processes of rule-making, project selection, and project execution.
Medium Term (2030 – 2040)
In the medium term, we’d expect I-1631 to catch up to and surpass I-732, if the clean energy funds are spent effectively and with additionality. In the early years, I-1631’s price will grow faster than I-732’s because its flat $2 escalator is initially larger than I-732’s 3.5%. That will enable I-1631 to close the gap and reduce I-732’s price advantage. By 2030, we estimate that I-1631’s price will be within $5 (or 15%) of I-732’s. In addition, I-1631 will be generating a substantial amount of revenue for its now fully functioning clean energy program. This dual-pronged approach should outstrip the impact of pricing alone, especially if the spending program is effective at addressing other market failures (like those listed above).
It’s possible that SB 6203 could catch up to I-732 if its clean energy funds are spent very well; however, its price freezes in 2030. SB 6203’s spending advantage will diminish as I-732’s price advantage grows.
Long Term (2040 – 2050+)
What happens in the longer term depends on whether pricing signals or spending programs prove more effective at reducing emissions. Another factor is what happens at the 2035 checkpoint for I-1631, when the state’s emissions are compared to our statutory targets. If the legislature does not update the state’s current, relatively weak GHG targets, I-1631’s price is likely to freeze — and I-732’s price advantage would start to grow rapidly. Even if I-1631’s price doesn’t freeze, I-732’s 3.5% escalator would start to grow faster around 2041. However, I-732 reaches its own checkpoint around 2044, when its price hits the policy’s ceiling of $100. At that point, I-1631 should still be investing quite a bit of money through its clean energy program.
If one thing is clear, it is this: We will be a lot better off in the long run with a carbon pricing system in place.