DASHBOARD DIGEST
The Dashboard Digest article series takes a deeper look into the policies that we track in the State Climate Policy Dashboard.
Photo Illustration: Amanda Pontillo, Climate XChange
The Dashboard Digest is intended to serve as a resource to state policy actors who are seeking to increase their understanding of climate policies, learn from experts in each policy area, and view examples of states that have passed model policies.
Each Policy Area (Governance and Equity, Adaptation & Resilience, Electricity, Buildings & Efficiency, Transportation, Agriculture, and Industry, Materials & Waste Management) is broken down into categories of individual policies. The Dashboard Digest will examine each policy category through a guiding principle, framework, or theme to provide valuable context to analyze and design individual policies.
For each category, there will be a Policy Primer article that introduces the thematic framework for the policies that we track. Following this introductory article will be individual briefs on each policy including an in-depth description, policy components, and examples of model state policies that have been passed. We will utilize the strength of our State Climate Policy Network by including interviews with network members and stories from people on the ground working to pass climate policies.
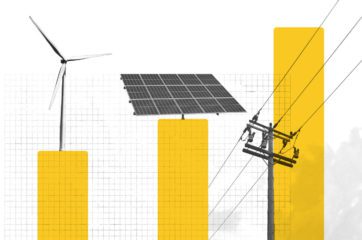
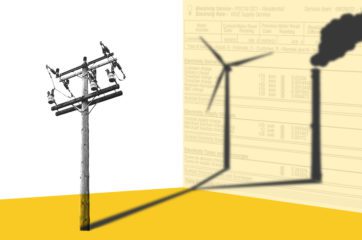
ELECTRICITY
Policies that increase renewable electricity, modernize the grid, and otherwise reduce emissions in the electricity sector
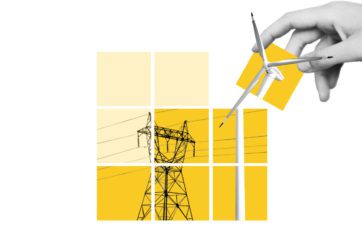
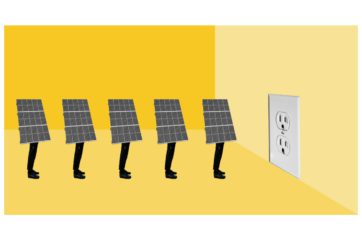
RENEWABLES & ENERGY STORAGE
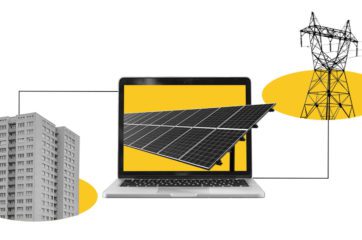
Policy Explainer: Expanding Access to Clean Energy with Shared Renewables
Climate XChange’s Dashboard Digest is a deep dive on each of the policies that we track in the State Climate Policy Dashboard and an exploration of how these policies can interact with one another to form a robust policy landscape....
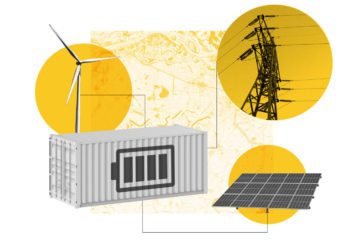
Policy Explainer: How Energy Storage Policies Can Allow Grids to Run on Renewables
Climate XChange’s Dashboard Digest is a deep dive on each of the policies that we track in the State Climate Policy Dashboard and an exploration of how these policies can interact with one another to form a robust policy landscape....
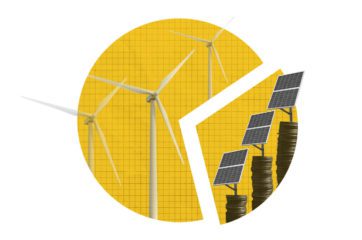
Policy Explainer: Creating Renewable Energy Markets Through Solar Carve-Outs
Climate XChange’s Dashboard Digest is a deep dive on each of the policies that we track in the State Climate Policy Dashboard and an exploration of how these policies can interact with one another to form a robust policy landscape....
Policy Explainer: Creating Demand for Clean Energy with Renewable Portfolio Standards
Climate XChange’s Dashboard Digest is a deep dive on each of the policies that we track in the State Climate Policy Dashboard and an exploration of how these policies can interact with one another to form a robust policy landscape....
Policy Explainer: Building Foundations for Renewable Energy through Net Metering
Climate XChange’s Dashboard Digest is a deep dive on each of the policies that we track in the State Climate Policy Dashboard and an exploration of how these policies can interact with one another to form a robust policy landscape....
Policy Primer: Unlocking Renewable Energy Potential through Policy Stacking
Climate XChange’s Dashboard Digest is a deep dive on each of the policies that we track in the State Climate Policy Dashboard and an exploration of how these policies can interact with one another to form a robust policy landscape....
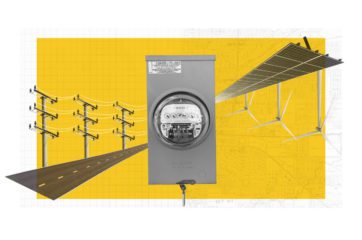
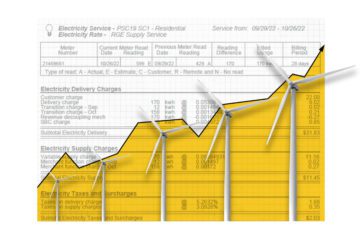
GRID & UTILITY REFORM
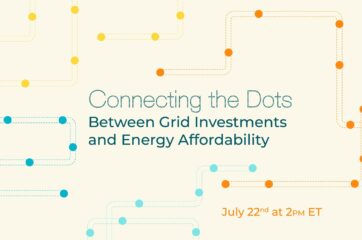
Webinar Recap: Connecting the Dots Between Grid Investments and Energy Affordability
Investing in our energy grid secures reliable, resilient electricity and saves money in the long run. However, state policies working to accelerate these investments — including modernizing our transmission grid or expanding it to connect to new clean energy resources...
Policy Explainer: How States Can Expand Consumer Power Choices
Climate XChange’s Dashboard Digest is a deep dive on each of the policies that we track in the State Climate Policy Dashboard and an exploration of how these policies can interact with one another to form a robust policy landscape....

Policy Explainer: What States Can Do to Modernize the Grid
Climate XChange’s Dashboard Digest is a deep dive on each of the policies that we track in the State Climate Policy Dashboard and an exploration of how these policies can interact with one another to form a robust policy landscape....
Policy Explainer: Fast-Tracking Renewables with Interconnection Standards
Climate XChange’s Dashboard Digest is a deep dive on each of the policies that we track in the State Climate Policy Dashboard and an exploration of how these policies can interact with one another to form a robust policy landscape....
Policy Explainer: How Utility Reform Can Align Profits with Climate Goals
Climate XChange’s Dashboard Digest is a deep dive on each of the policies that we track in the State Climate Policy Dashboard and an exploration of how these policies can interact with one another to form a robust policy landscape....
Policy Explainer: Designing a Roadmap for Decarbonization with Clean Energy Plans
Climate XChange’s Dashboard Digest is a deep dive on each of the policies that we track in the State Climate Policy Dashboard and an exploration of how these policies can interact with one another to form a robust policy landscape....

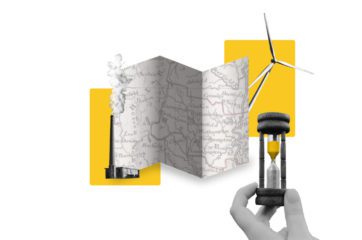
Policy Primer: The Grid Isn’t Broken, But Still Needs Fixing
Climate XChange’s Dashboard Digest is a deep dive on each of the policies that we track in the State Climate Policy Dashboard and an exploration of how these policies can interact with one another to form a robust policy landscape....
BUILDINGS & EFFICIENCY
Policies that decarbonize and reduce energy use in the buildings sector
BUILDINGS & ENERGY EFFICIENCY

Policy Explainer: Reducing Buildings Sector Emissions by Financing Energy Efficiency Projects
Climate XChange’s Dashboard Digest is a deep dive on each of the policies that we track in the State Climate Policy Dashboard and an exploration of how these policies can interact with one another to form a robust policy landscape....

Policy Explainer: How States Can Create Resilient and Sustainable Cities Through Cool Roof Policy
Destiny Gonzalez ǀ Policy & Research ProgramThis summer, cities endured soaring temperatures well beyond 100°F, making it likely the hottest summer on global record. Urban settings tend to trap more heat than less densely populated areas — straining economic resources,...

Policy Explainer: How Appliance Standards Can Cut Emissions and Increase Savings
Climate XChange’s Dashboard Digest is a deep dive on each of the policies that we track in the State Climate Policy Dashboard and an exploration of how these policies can interact with one another to form a robust policy landscape....

Policy Explainer: How States Can Leverage Weatherization Assistance Programs to Reach Climate Targets
Climate XChange’s Dashboard Digest is a deep dive on each of the policies that we track in the State Climate Policy Dashboard and an exploration of how these policies can interact with one another to form a robust policy landscape....

Policy Explainer: Writing a Blueprint for Efficiency with Energy Codes
Climate XChange’s Dashboard Digest is a deep dive on each of the policies that we track in the State Climate Policy Dashboard and an exploration of how these policies can interact with one another to form a robust policy landscape....
Policy Explainer: How Energy Efficiency Resource Standards Align Utility Profits with Energy Savings
Climate XChange’s Dashboard Digest is a deep dive on each of the policies that we track in the State Climate Policy Dashboard and an exploration of how these policies can interact with one another to form a robust policy landscape....

Policy Primer: Why States are Targeting Buildings Policies to Meet Their Climate Goals
Climate XChange’s Dashboard Digest is a deep dive on each of the policies that we track in the State Climate Policy Dashboard and an exploration of how these policies can interact with one another to form a robust policy landscape....
INDUSTRY, MATERIALS, & WASTE MANAGEMENT
Policies that limit Short-Lived Climate Pollutants, industrial emissions, and material waste
INDUSTRY, MATERIALS, & WASTE MANAGEMENT

Policy Explainer: State-Level Strategies to Reduce HFC Emissions
Climate XChange’s Dashboard Digest is a deep dive on each of the policies that we track in the State Climate Policy Dashboard and an exploration of how these policies can interact with one another to form a robust policy landscape....

Policy Explainer: How States Can Cut Methane Emissions Through Food Waste Bans and Targets
Climate XChange’s Dashboard Digest is a deep dive on each of the policies that we track in the State Climate Policy Dashboard and an exploration of how these policies can interact with one another to form a robust policy landscape....

Policy Explainer: Drilling Down on State Efforts to Ban Fracking
Climate XChange’s Dashboard Digest is a deep dive on each of the policies that we track in the State Climate Policy Dashboard and an exploration of how these policies can interact with one another to form a robust policy landscape....

Policy Explainer: Reducing SF6 Emissions through Power Sector Regulations
Climate XChange’s Dashboard Digest is a deep dive on each of the policies that we track in the State Climate Policy Dashboard and an exploration of how these policies can interact with one another to form a robust policy landscape....