Grid & Utility Reform
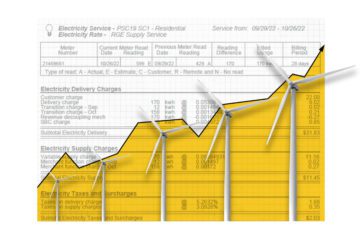
Webinar Recap: Connecting the Dots Between Grid Investments and Energy Affordability
Investing in our energy grid secures reliable, resilient electricity and saves money in the long run. However, state policies working to accelerate these investments — including modernizing our transmission grid or expanding it to connect to new clean energy resources...
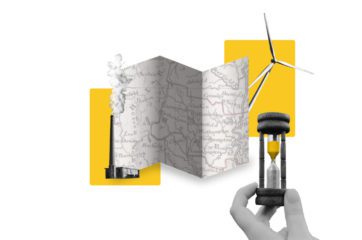
Policy Explainer: How States Can Expand Consumer Power Choices
Climate XChange’s Dashboard Digest is a deep dive on each of the policies that we track in the State Climate Policy Dashboard and an exploration of how these policies can interact with one another to form a robust policy landscape....
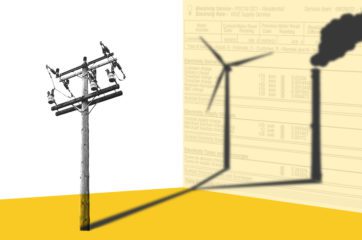
Policy Explainer: What States Can Do to Modernize the Grid
Climate XChange’s Dashboard Digest is a deep dive on each of the policies that we track in the State Climate Policy Dashboard and an exploration of how these policies can interact with one another to form a robust policy landscape....
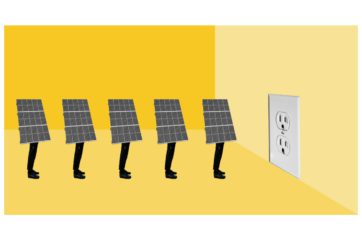
Policy Explainer: Fast-Tracking Renewables with Interconnection Standards
Climate XChange’s Dashboard Digest is a deep dive on each of the policies that we track in the State Climate Policy Dashboard and an exploration of how these policies can interact with one another to form a robust policy landscape....
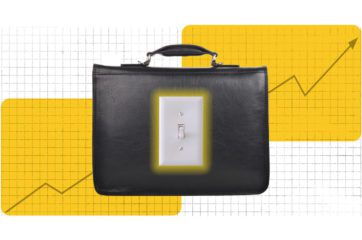
Policy Explainer: How Utility Reform Can Align Profits with Climate Goals
Climate XChange’s Dashboard Digest is a deep dive on each of the policies that we track in the State Climate Policy Dashboard and an exploration of how these policies can interact with one another to form a robust policy landscape....
Policy Explainer: Designing a Roadmap for Decarbonization with Clean Energy Plans
Climate XChange’s Dashboard Digest is a deep dive on each of the policies that we track in the State Climate Policy Dashboard and an exploration of how these policies can interact with one another to form a robust policy landscape....
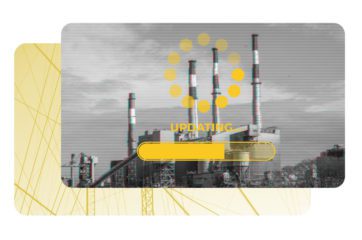
Policy Primer: The Grid Isn’t Broken, But Still Needs Fixing
Climate XChange’s Dashboard Digest is a deep dive on each of the policies that we track in the State Climate Policy Dashboard and an exploration of how these policies can interact with one another to form a robust policy landscape....