Renewables & Energy Storage
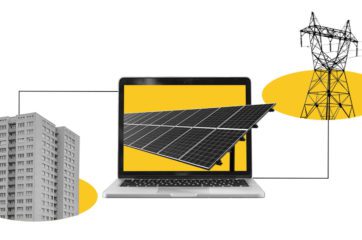
Policy Explainer: Expanding Access to Clean Energy with Shared Renewables
Climate XChange’s Dashboard Digest is a deep dive on each of the policies that we track in the State Climate Policy Dashboard and an exploration of how these policies can interact with one another to form a robust policy landscape....
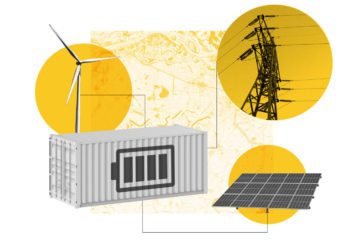
Policy Explainer: How Energy Storage Policies Can Allow Grids to Run on Renewables
Climate XChange’s Dashboard Digest is a deep dive on each of the policies that we track in the State Climate Policy Dashboard and an exploration of how these policies can interact with one another to form a robust policy landscape....
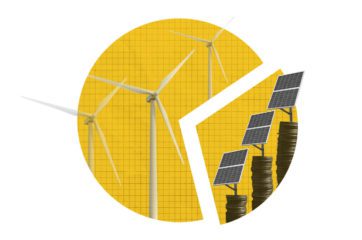
Policy Explainer: Creating Renewable Energy Markets Through Solar Carve-Outs
Climate XChange’s Dashboard Digest is a deep dive on each of the policies that we track in the State Climate Policy Dashboard and an exploration of how these policies can interact with one another to form a robust policy landscape....
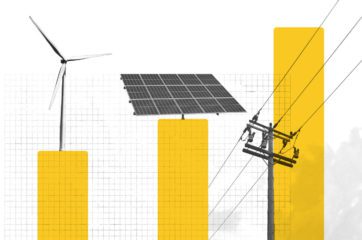
Policy Explainer: Creating Demand for Clean Energy with Renewable Portfolio Standards
Climate XChange’s Dashboard Digest is a deep dive on each of the policies that we track in the State Climate Policy Dashboard and an exploration of how these policies can interact with one another to form a robust policy landscape....
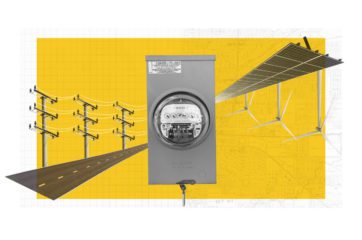
Policy Explainer: Building Foundations for Renewable Energy through Net Metering
Climate XChange’s Dashboard Digest is a deep dive on each of the policies that we track in the State Climate Policy Dashboard and an exploration of how these policies can interact with one another to form a robust policy landscape....

Policy Primer: Unlocking Renewable Energy Potential through Policy Stacking
Climate XChange’s Dashboard Digest is a deep dive on each of the policies that we track in the State Climate Policy Dashboard and an exploration of how these policies can interact with one another to form a robust policy landscape....