This report analyzes the potential jobs and community health benefits created by a sample portfolio of investments in Washington State. We find that investing in clean transportation, forest conservation and ecosystem restoration, clean energy, water and energy efficiency, low carbon agriculture, and sustainable industry supports over ten jobs per million dollars invested. By comparison, the state’s ten largest industries support 4.3 jobs per million dollars invested. Additionally, we find that every million dollars invested in these programs accrues $2.4 million in clean air and climate benefits. These findings can help state policymakers design an economic recovery plan in response to the COVID-19 crisis that maximizes both job creation and the long-term health of Washington communities.
Washington has been hit hard by the COVID-19 health and economic crises. According to the Washington State Department of Health, over 1,200 Washingtonians have died of COVID-19 between February and June of this year. [1] This is roughly equivalent to the number of deaths the Puget Sound Clean Air Agency attributes to outdoor air pollution each year in Washington State. [2] Additionally, a record 1.1 million Washington workers filed for unemployment in the first few months of the crisis, with unemployment reaching a record-high 16.3 percent in April. [3]
The ability of Washington communities to bounce back from these crises will hinge on the short and medium-term policy choices of the state and federal government. Incoming stimulus dollars, whether from the federal government or elsewhere, need to be efficiently deployed for maximum high-quality job creation and long-term durable health and climate benefits. This report is intended to help guide a smart direction towards achieving these outcomes through well-crafted stimulus programs.
Building a Resilient Recovery Portfolio for Washington
This study is motivated by the urgent need to rebuild and create new economic growth and healthier communities in Washington State. To meet this challenge, Climate XChange and the Low Carbon Prosperity Institute analyzed the economic and health impacts of 14 different investment programs. The programs were analyzed for their job creation, wage and benefit levels, and value added to the state economy using IMPLAN economic modeling. They were subsequently evaluated for community health and climate benefits per million dollars invested.
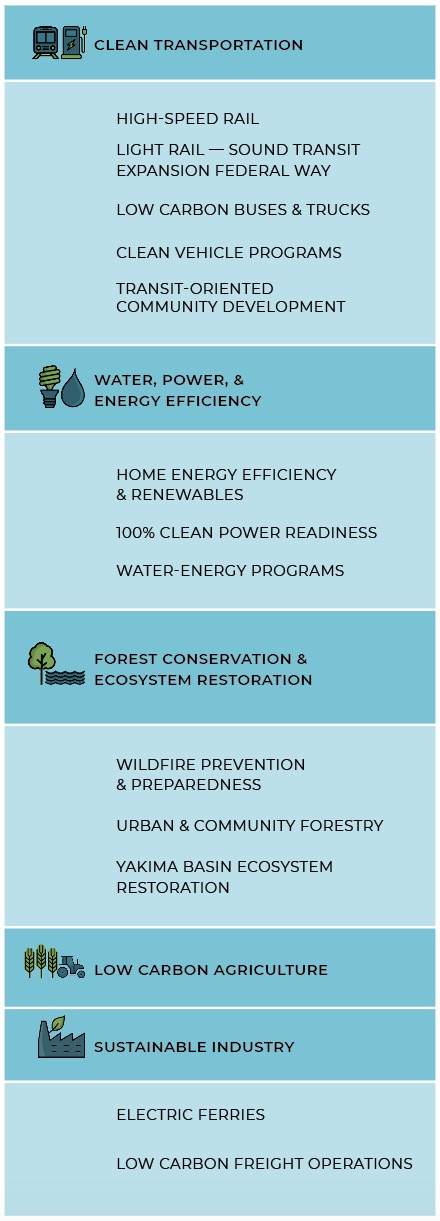
Based on our analysis, the most effective path to economic recovery prioritizes investments in what we refer to as the Resilient Recovery Portfolio, which includes programs in clean transportation, forest conservation and ecosystem restoration, clean energy, water and energy efficiency, low carbon agriculture, and sustainable industry. We find that the co-benefits derived from these investments greatly outweigh their upfront costs, and provide robust job creation and significant community health benefits. These programs will also help the state build the jobs, industries, and services that will help it prosper in the thirty-plus year transition towards a net zero-emissions future.
This analysis provides a screening tool for Washington policymakers and stakeholders to use in constructing a recovery plan at the nexus of jobs and community health. However, while the Resilient Recovery Portfolio examined in this report is built with an emphasis on Washington State, the broader takeaways hold up across state lines, even if the specific portfolio may need to be tailored to best suit local strengths and opportunities. The quantitative methodology we developed can empower and inform subsequent strategies and support a healthier, more sustainable, and prosperous future for all Americans.
The Resilient Recovery Portfolio Consists of:
Key Findings
Jobs and Economic Benefits
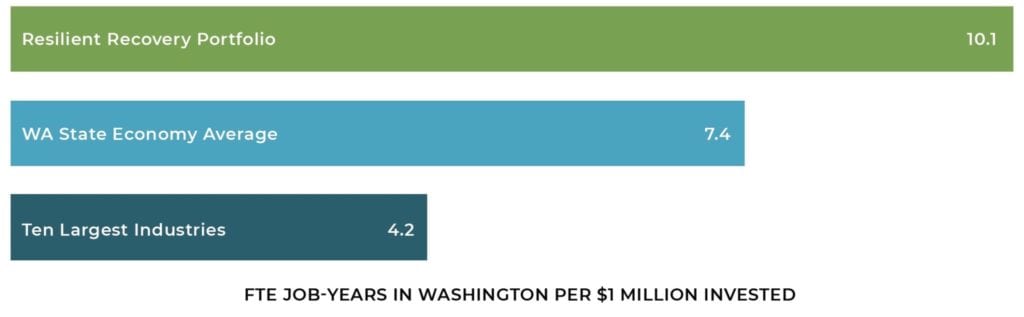
We find that every million dollars invested in the Resilient Recovery Portfolio creates 10.1 full-time-equivalent jobs, compared to 4.3 full-time-equivalent jobs created per million dollars invested in the state’s largest industries. The investments also outperform the broader state economy benchmark, which supports 7.4 full-time-equivalent jobs per million dollars invested. This is because the Resilient Recovery Portfolio supports labor-intensive businesses that conduct most of their economic output and activities within the state’s economy.
Figure 1.1: Job creation from the Resilient Recovery Portfolio compared to economy benchmarks
Across all 14 programs included in the portfolio, the job creation potential ranges from 6.4 to 15 full-time-equivalent jobs created per million dollars invested. The jobs supported by these investments are diverse and cut across many different industries and economic sectors, with particularly strong job creation in construction, support activities for agriculture and forestry, transit and ground transportation, and individual and family services. For example, we find that Yakima Basin Ecosystem Restoration, Sound Transit Expansion, Wildfire Prevention and Preparedness, Urban and Community Forestry, and Low Carbon Buses and Trucks provide the most robust job performance per dollar invested.
Figure 1.2: Job creation and earnings by investment program
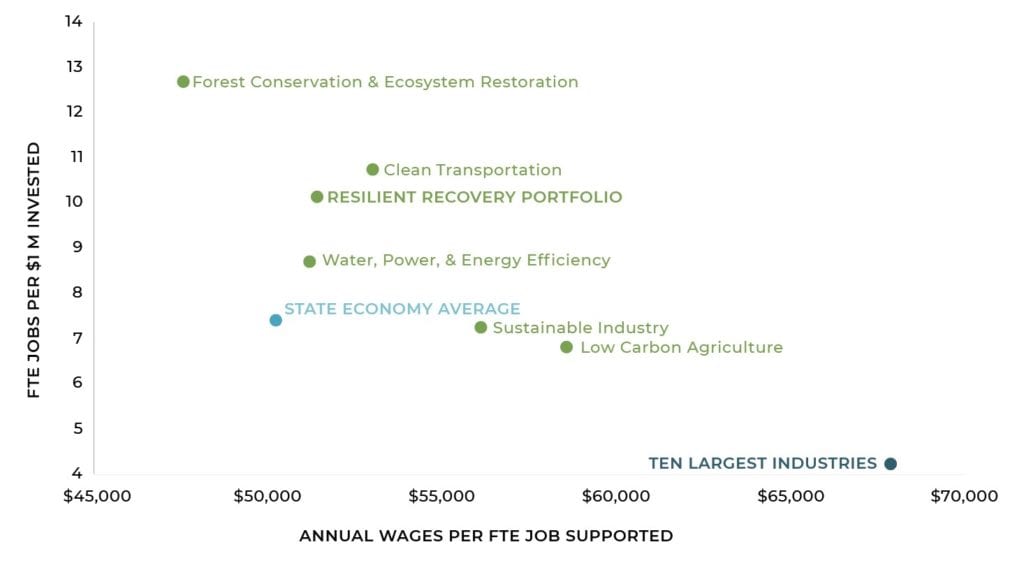
These investments support labor-intensive productive businesses in the state with $0.64 of each dollar invested supporting employee compensation, compared to $0.40 in the state’s ten largest industries. They also provide robust broader economic value, both in terms of gross state product ($0.94 for every dollar spent versus $0.50 for the state’s largest industries), as well as overall productive output ($1.75 for every dollar invested versus $1.59 for the state’s largest industries). Jobs in the Resilient Recovery Portfolio average a wage and salary level of $51,400 per year. This is slightly higher than the broader state economy, although no investment programs in the portfolio match the average wage levels of the ten largest industries.
Community Health and Climate Benefits
Beyond the job creation potential of the programs identified, the Resilient Recovery Portfolio also results in significant community health benefits through cleaner air. These investments work to improve the state’s energy security by reducing the drain on the local economy from importing fossil fuels while removing damaging pollutants from the air we breathe. Every million dollars invested in the Resilient Recovery Portfolio offers $2.4 million in health and climate benefits, including $1.6 million in clean air benefits. The results are particularly accentuated by the projected impact of the Wildfire Prevention and Preparedness Program, which avoids over $12 million in health and climate damages for every million dollars spent.
Figure ES.3: Community Health and Climate Benefits from the Resilient Recovery Portfolio

Community health benefits are likely to be enduring and improve over time as Washington moves towards a net zero-emissions future. Sustaining and expanding these programs in order to meet the state’s climate goals would unlock net health and climate benefits of $46 billion through 2050 while continuing demand for the types of jobs highlighted in this report.
Next Steps & Policy Making
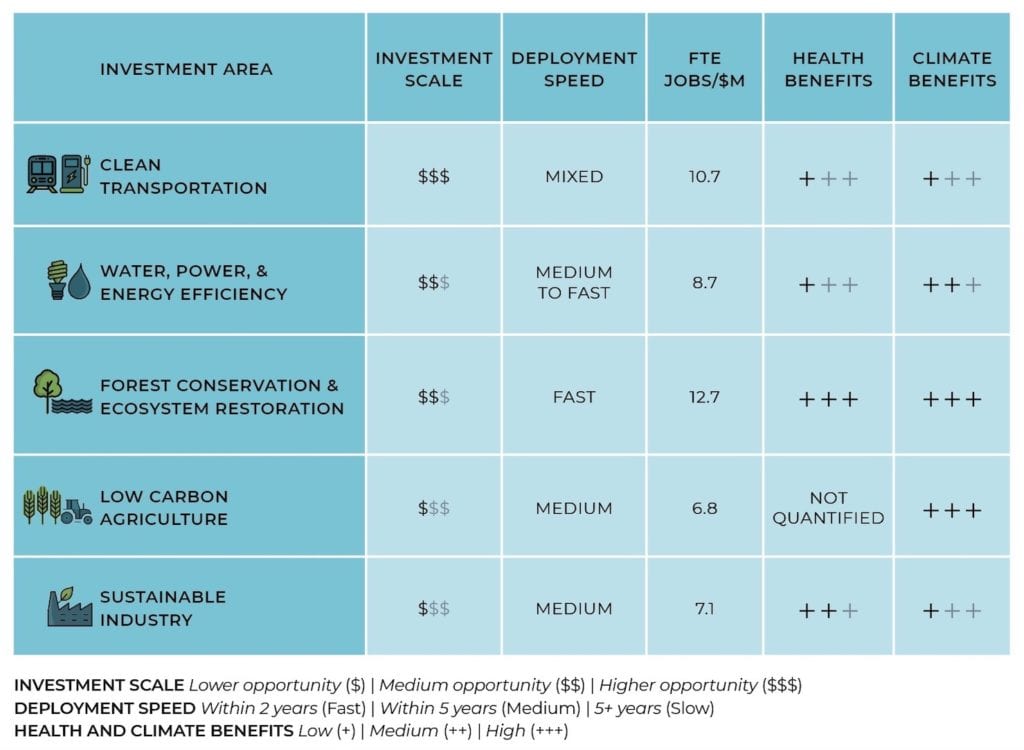
We present findings throughout this report as comparative “multipliers,” which normalize all benefits to a million dollar investment. To complement our findings, we offer two additional factors: investment scale and deployment speed (see Table ES.1). Investment scale refers to the size of funding required to exhaust available investment opportunities from the Resilient Recovery Portfolio, whereas deployment speed refers to the pace at which projects can be feasibly implemented to facilitate rapid employment.
Table ES.1 Overview of Findings by Investment Area
This report and the Resilient Recovery Portfolio are intended to provide a data-driven starting point for discussions about recovery measures in Washington. IMPLAN does not provide a comprehensive picture of job quality, and that metric is, therefore, outside the scope of this study. We recommend additional analysis be conducted to carry these findings forward, emphasizing:
- Social justice, community engagement, and analysis of the distributional economic and health outcomes of selected recovery measures.
- Job quality, career advancement opportunities, local and diverse access, and other occupation-specific components of jobs supported.
- Expansion of the Resilient Recovery Portfolio to additional programs that have the potential to deliver community benefits at the nexus of quality job creation and community health.
- Potential contributions and compatibility of stimulus measures with Washington’s long-term climate goals, and the net benefits of achieving those goals.
- Further work to bridge this portfolio to a workable policy, assess optimal investment scale, and identify possible financing mechanisms.
Conclusion
This report and the Resilient Recovery Portfolio addresses the dual challenges exacerbated by the COVID-19 pandemic: economic recovery and community health. The job creation potential and investment returns through the local economy are compelling, firmly outpacing both the largest industries in the state and economy-wide benchmarks. These programs also collectively offer a positive return on investment in clean air benefits and avoided climate damages.
This type of jobs portfolio and investment mindset can kick-start both short-term and long-term job growth, shared economic prosperity, and cleaner air. By developing and investing with this type of approach, Washington can lead the transformation America needs to recover from the current crisis and build a healthier, more resilient future.
Endnotes
- Washington State Department of Health, 2020. “COVID-19 Data Dashboard.” t.ly/o9BW
- Puget Sound Clean Air Agency. “Air Pollution and Your Health.” https://pscleanair.gov/161/Air-Pollution-Your-Health
- Bureau of Labor Statistics, 2020. https://www.bls.gov/web/laus/lauhsthl.htm