As legislative sessions wrap up across the country and billions of federal climate dollars continue flowing to states, identifying priorities for future policy action is critical. To help states understand these opportunities, RMI partnered with Climate XChange on 20 State Climate Scorecards analyzing how states are progressing toward climate-aligned targets. The scorecards use the State Energy Policy Simulator models to:
- Explore each state’s progress on climate action,
- Assess how current climate and clean energy policies will help meet emissions reduction goals, and
- Identify gaps in each state’s policy landscape that can further mitigate climate change.
Using these scorecards, our panel of experts from RMI and Climate XChange explored how the U.S. landscape of state-level climate policy will help us reach our climate goals, including which states are leading the charge, what policies are essential to meet emissions reduction targets, and how states can pass ambitious, science-based climate policy to close remaining gaps.
In this recap article, we’ll provide highlights from our expert panel’s presentations and Q&A, including: (1) the methodology used to create state targets and model emissions reductions from existing climate policy; (2) high-level takeaways on which policies impact climate progress; and (3) how states can move forward with translating this new analysis into further climate action.
Nathan Iyer, RMI
Nathan Iyer is a Senior Associate with the U.S. program at RMI. He helped design and build 48 state-level energy policy simulator tools to support effective subnational climate and energy packages in partnership with Energy Innovation. He also worked at the federal level to advocate for and design industrial decarbonization provisions in the Inflation Reduction Act.
Meeting the Need for Robust Climate Progress Tools
The energy transition is a multi-decade, multi-sector challenge, with complex layers of policies, technologies, and economic trends that change every day. In order to meet this problem at the state level, we must have robust, open-source tools to track and analyze new data and developments. The three major pieces of information needed to accurately understand a state’s emissions and project where policy may take them are (1) calibrated state data and projections on policies and emissions; (2) multi-sector policy modeling to connect the dots on interrelated impacts; and (3) sector and subsector visualizations of changes over time at various scales. To address these three factors, RMI and Energy Innovation developed 48 State Energy Policy Simulators (EPS), which evaluate decarbonization policies and visualize factors like cash flow, job growth, emissions, and more.
Using these state-level EPS models, RMI and Climate XChange developed 20 State Climate Scorecards which analyze how far each state has progressed toward Paris Agreement-aligned climate targets and how far it’s projected to progress by 2030, based on current policy and economic trends.
Methodology: Setting State Climate Targets for the Scorecards
To set each of the 20 states’ individual 2030 targets for these scorecards, we first looked at the national emissions reduction target for the United States. This is also known as the Nationally Determined Contribution (NDC), in accordance with the Paris Agreement’s goal to limit the global average temperature to below 2°C above pre-industrial levels. The NDC for the U.S. is an emissions reduction of 50-52 percent compared to 2005 levels by 2030. Importantly, not all emissions will be abated equally across states or sectors, especially in the near-term. For example, shutting down a coal plant will have an immediate emissions reduction, whereas transitioning the vehicle fleet to all-electric vehicles will take years to reflect in terms of the entire fleet’s actual emissions. Emissions reductions lag behind deployment, meaning it may take up to 15 or 20 years to achieve the maximum emissions reductions of a single policy.
To set state-specific targets, we used Energy Innovation’s multi-sector policy scenario for their national model depicting the 2030 and 2050 NDC targets for the U.S. and applied that same policy package to each state. Based on the current breakdown of emissions and policy efficacy, the resulting targets vary by state and by sector.
Ruby Wincele, Climate XChange
Ruby Wincele is the Policy & Research Manager at Climate XChange, where she researches the economic, social, and environmental benefits of state climate policy and provides technical assistance to policymakers and advocates working to pass equitable climate policy in their states. She also tracks climate mitigation and adaptation policies across every state for the State Climate Policy Dashboard.
Methodology: Understanding and Quantifying Each State’s Climate Policy
New state-level climate policies are popping up by the day, with multiple recent climate wins in the past few years alone including Minnesota’s target of 100 percent clean energy by 2040, the establishment of dozens of green banks across the country, and the adoption of 100 percent electric vehicle standards modeled after California’s clean vehicle regulations. Climate XChange’s State Climate Policy Dashboard tracks these and other enacted state climate policies — over 65 types of policy — across all 50 states.
Using this Dashboard and further policy research, we collected and reviewed every major state climate policy — including enacted legislation and regulations, excluding executive orders — passed before June of 2023 for each of the 20 scorecard states. Of these policies, we narrowed the list down to modelable policies with a quantifiable impact; for example, policies like broad emissions reduction targets and general climate funding cannot be tangibly modeled like coal plant shutdowns and clean energy standards. Modelable policies must also be bankable to be included in the scorecards, meaning they are currently in place, legally enforceable, and quantifiable using well-established methods.
After determining each state’s modelable climate policies, we then used the state-specific EPS models to create a scenario that quantifies the state’s policy impacts. This state-specific “current policy scenario” was then compared to the 2030 policy scenario that aligns with the aforementioned state-level targets, as informed by the U.S. NDC of a 50-52 percent emissions reduction.
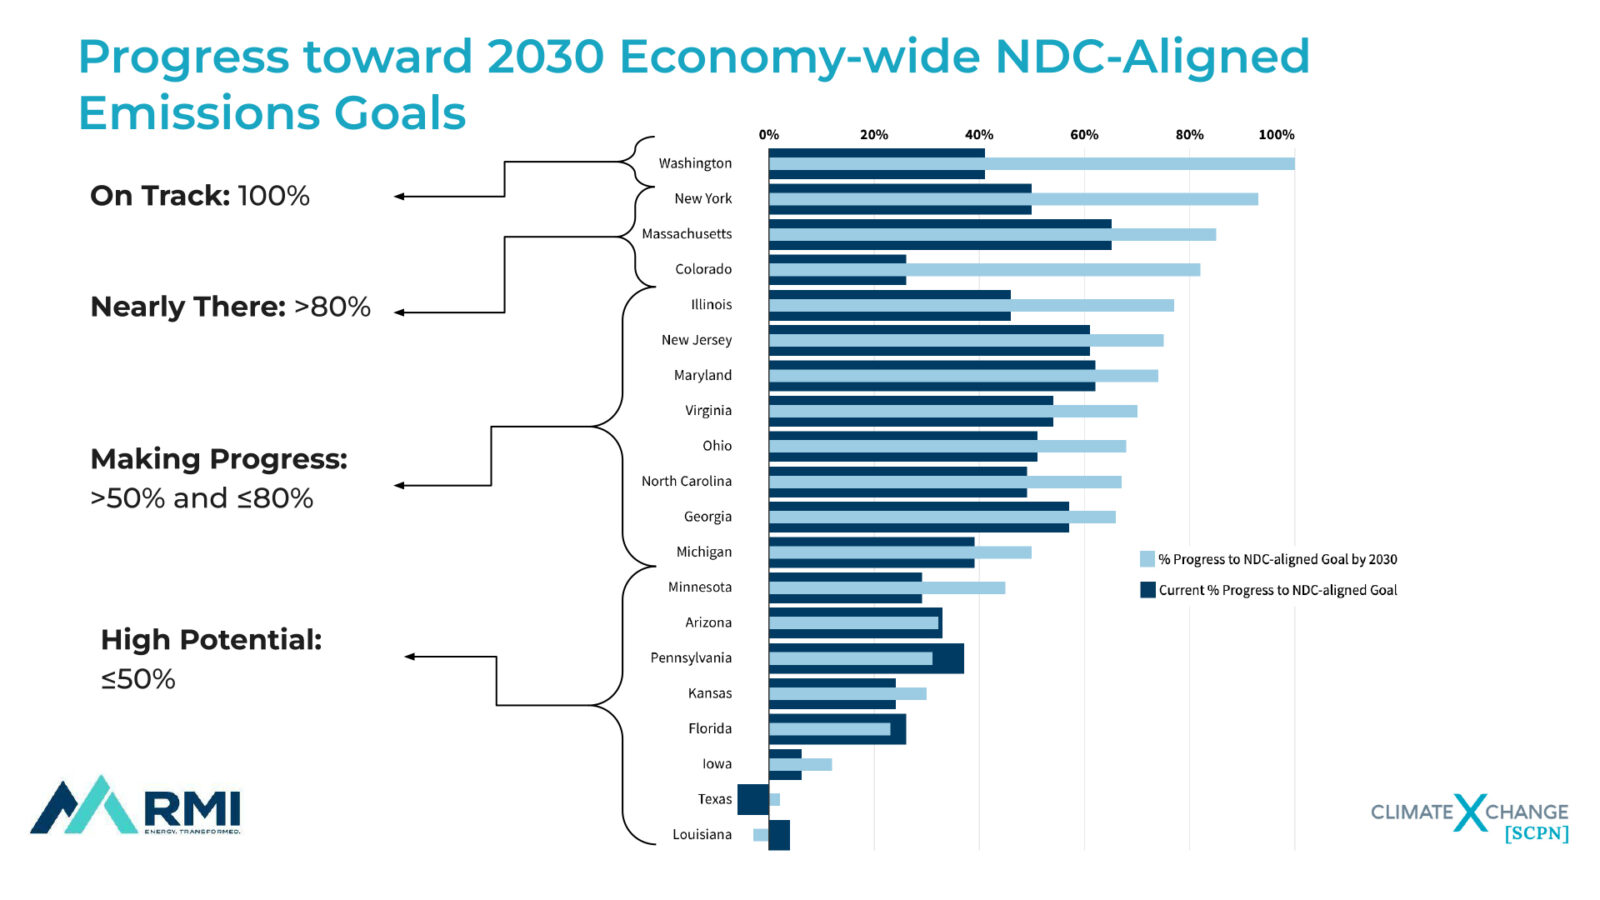
Of the 20 states modeled for these scorecards, the only state that is on track to reach its economy-wide NDC-aligned target is Washington, although the state still needs to take further action to meet its own (stricter) climate targets. Other leading states — New York, Massachusetts, and Colorado — are over 80 percent of the way to their 2030 NDC-aligned targets. Eight states are between 50 and 80 percent of the way to their targets: Illinois, New Jersey, Maryland, Virginia, Ohio, North Carolina, Georgia, and Michigan.Eight states are less than 50 percent of the way: Minnesota, Arizona, Pennsylvania, Kansas, Florida, Iowa, Texas, and Louisiana.
What Policies are Driving Major Emissions Reductions?
One of the main findings from this analysis is that certain foundational policies are doing the heavy lifting of getting states on track for their targets. Sector-based policies like clean energy standards and renewable portfolio standards, zero-emissions vehicle mandates like Advanced Clean Cars and Trucks, and building code updates are driving decarbonization.
Economy-wide policy coverage is also majorly reducing emissions, including cap-and-invest programs like in Washington, and clean technology incentives across sectors. In addition, market forces are driving clean technology adoption, especially in states without many major climate policies, like Georgia and Ohio. The cost-efficiency of clean technology is reflected in electric vehicle adoption, early coal plant retirements, and the implementation of energy-efficient building technology like heat pumps and efficient appliances.
States have also been innovating in terms of sector-specific policies, as the aforementioned foundational policies driving emissions reductions do not cover all sectors — for example, updating energy codes alone isn’t sufficient to meet buildings sector decarbonization. However, there’s no need to reinvent the wheel — simply look to other states that are further along in their decarbonization process. In the example of the buildings sector, states are already innovating in building performance standards, as in Maryland, and policies requiring all-electric heating and cooling, as in New York.
Ashna Aggarwal, RMI
Ashna Aggarwal is a Senior Associate at RMI who develops and uses the state-level, open-source Energy Policy Simulator models to find the best policies to achieve climate goals. She also works on strategies to scale clean energy technologies, such as how to build a strong clean technology supply chain.
How to Use the Scorecards: Identifying Climate Policy Solutions
An important piece of these scorecards are the sub-sector level metrics, which track the technologies and sources critical to tangible emissions reductions. Since emissions are a lagging metric by 15-20 years, targeting sub-sector metrics can help put your state on track to meet NDC-aligned goals.
The scorecards find that progress in sub-sector level metrics vary widely by state, but there are overall trends. For some metrics, states are making substantial progress on average, as with light duty electric vehicles on the road — leading states are projected to meet 100 percent alignment with NDC-aligned targets, while the lagging states are between 40-60 percent of the way there.
However, on average, states are struggling to meet other NDC-aligned targets particularly in relation to oil and gas methane abatement, reductions in building gas consumption, and zero-emissions trucks. As with many of these metrics, we can look to existing state and federal policy to make the progress needed to reach NDC-alignment by 2030. For oil and gas methane abatement, look to Colorado’s recent regulations increasing repairs of leaky equipment and setting an intensity target for oil and gas operators. For reducing gas consumption in buildings, states can take advantage of federal rebates and tax credits for building appliance electrification in the Inflation Reduction Act (IRA). For zero-emissions trucks, look to California’s Advanced Clean Trucks rule, as well as incentives from the IRA like the Clean Heavy-Duty Vehicles Program that fund the deployment of zero-emission trucks.
Beyond the Scorecards: Further Resources to Accelerate Climate Progress
These 20 State Climate Scorecards are complemented by a suite of various other resources that aim to identify gaps and propose solutions for climate policy and progress. The first is the Energy Policy Simulator (EPS) for states, developed by RMI and Energy Innovation, which is a tool that allows users to design state policy packages and see the effects on various metrics, like emissions reductions and public health or economic impacts. The State EPS Data Dashboard, developed by RMI and Sustainability Solutions Group and launched alongside the Scorecards, uses the EPS and pre-existing policy scenarios by state to provide projected climate, health, and economic impacts. Using this Dashboard, you can visualize patterns across states, sectors, and policy scenarios, as well as single state dashboards that can help identify the remaining major sources of emissions in a given year to inform where states should focus policy efforts.
For further insights on climate policy examples and solutions, the State Climate Policy Dashboard, created by Climate XChange, includes a State Tracker that aggregates the adoption of over 65 types of climate policy across all 50 states, as well as a Resource Hub which provides information, resources, and policy examples across seven distinct climate policy areas. In addition, the Evergreen Policy Hub provides links to reports and articles on how to meet national and state-level climate targets.
Q&A
Q: What sorts of climate policies should we keep an eye out for that have substantial emissions reductions?
Ruby Wincele: So, this year, we’ve seen a lot of progress in terms of adopting those 100 percent EV sales standards that I mentioned. Starting this past August is when Advanced Clean Cars II, which requires that 100 percent of new passenger vehicle sales are electric by 2030, was adopted by California, which then set off the process of adopting those same regulations in other states. Off the top of my head, I don’t have the exact number of states, but it’s, I want to say around 15 or so adopting those light duty EV sales standards, and it’s similar with Advanced Clean Trucks, for those medium and heavy duty vehicle sales standards. And then, in the building sector, I’m sure people have seen this all over the news, but pay attention to these local and state level all-electric building requirements, requiring new buildings to be built fully electric, in states like New York where they just included that in the state budget. And then, some more recent building policies include building performance standards, so far, three states, all Scorecard states, Washington, Colorado, and Maryland, have building performance standards. There’s more recent clean heat standards as well, we saw Vermont passed that this session. And a ton of policies to take advantage of federal funding as well. I mentioned green banks, those are kind of hard to quantify in the EPS. But we’ve seen for over a decade now they’ve proven to be successful in deploying clean energy technology in states and communities that might not otherwise have access to that capital.
Q: What are some policies that have surprisingly low emissions impacts based on your modeling?
Ashna Aggarwal: I can take a stab at that question. So, some of the policies that really target new technologies and stock — like building codes and even vehicle sales standards — are super important policies, but you’re not going to see those emissions reductions in the near term, just because of how long it takes for people to retire those technologies. I’d say, in terms of emissions reductions, those policies are really important, but not in the near term. And it just lends itself to people tracking things beyond just emissions reductions, thinking about things like clean technology sales, clean technology stock, and really understanding that the solutions are really going to be new infrastructure built in the ground.
Nathan Iyer: In addition, what can be frustrating for states and state advocates are hard-won policies that apply to sub-sub-sub-sectors. For example, if you’re looking at the buildings sector, and you’re only applying a policy to a certain subset of building types and a certain subset of cities, it can be a very hard policy to pass, because you’re still pushing very ambitious policy on a subset of buildings within the state. But because of the way that the math works, just a percent of a percent of a percent, the emissions reductions on a statewide basis can look quite disappointing. So, we do see this difference where there’s all the effort and time that states have poured into a specific policy, and then they’re not yielding the results that they feel like their effort should have yielded, and I don’t think this is necessarily a bad thing. Because what we find is that a lot of the time, those small seed policies that might not substantially move the needle between now and 2030 end up being the test case for a much more ambitious policy moving forward. So we saw that in ACC I, the Advanced Clean Cars standard, which had a slowly increasing EV sales target, initially, but then once EVs got cheap, once people started to really understand their potential with the supply chains, additional policies came down, and we saw the total cost of ownership of EVs really declining, then suddenly, the states were emboldened to do something much more ambitious, leading to the ACC II and some of these 100 percent targets. So it’s okay to have policies that aren’t yielding immediate emissions reductions, as long as we’re clear eyed, that these are not policies designed for that, and the game is not over. So the work is not over, we are using this as a learning experience to scale it in the near future. As long as we know what category each policy is in, I think that folks will have a lot better time understanding, in what bucket in their head, they should push for, because leadership oftentimes requires starting small.
Ruby Wincele: Yeah, and I also want to add that the scorecards focus on emissions, and that is hugely important when addressing the climate crisis. But we also want to see states passing policies that prioritize environmental justice and equity, create green jobs and some of these other benefits of climate policies, like reducing pollutant emissions in communities. Just looking at the greenhouse gas emissions only tells a fraction of the story of the benefits of all of these policies that we’re talking about.
Q: What are some of the types of policies that were not included in this modeling?
Ashna Aggarwal: The one thing that I’ll say off the bat is that we don’t include the Inflation Reduction Act yet in the model, just being really upfront, and that’s a work in progress for our end. So hopefully, in the future, we’ll be able to update our tools to reflect the Inflation Reduction Act, but in the Energy Policy Simulator itself, it is possible to model some of the major incentives from the IRA. So I would point you all to that resource, if you want to get a sense of what that does.
Nathan Iyer: One other thing I’d like to add on is that there are certain types of policies that are very hard to model. For example, imagine a large pool of funding that doesn’t go to any individual sector – you can run sensitivities, but saying this will drive down emissions in a sector or sub sector is very hard to accomplish. That’s the same with certain financial mechanisms as well, which are very unbounded — they’re useful tools, but it’s almost impossible to know exactly how they’re going to play out. You can also look at, for example, the Washington cap and invest program, which has a pool of funding which is pluripotent and can be used for many different things. So those kinds of things confound modelers, not just with RMI and Climate XChange, but across the board — but that doesn’t mean they’re not worth doing, so that’s an important note. And I think another piece is that there is going to be policy ambiguity, especially when we push forward on things like bottlenecks. For example, we can have a very ambitious clean energy standard, but that doesn’t necessarily solve the bottleneck of transmission or interconnection. Same with EVs, you can have an ambitious EV sales standard, it doesn’t necessarily solve the distribution issues. So once we have set a course to something ambitious, that doesn’t mean the work is over, there are going to be emergent bottlenecks, additional tools and additional analysis will be needed in order to make sure that we finish the drill. So just a large caveat on what this kind of modeling can do and what it cannot do is really important to make sure that everyone is using this in the appropriate context, but also not discarding things that cannot be fit into the box of this kind of modeling.
Q: Where is there momentum in states passing climate policy, especially in states that maybe haven’t led on climate in the past?
Nathan Iyer: I think there’s a number of very interesting pieces. Obviously, the large policies that we see actually moving the needle are important. A lot of the time, some of the early policies are kind of overwhelmed by other trends, either, you know, it’s deindustrialization, or economic crisis, or just population growth. So we’re finally seeing policies that are strong enough to move the needle, which is unique. There’s also just a variety of different options that are state specific, where we can really see states trying a lot of different things. We also see a lot of copying and pasting different ideas across states. So you’re kind of seeing the policy diffusion work, and you’re also seeing that laboratory of democracy or laboratory of decarbonization, in this case, work as well. And we need more of both.
Kayleigh Rubin: I think it’s incredible to see, states are hubs for innovation. And it’s clear that we have no shortage of great ideas, I think the challenge will be implementing those great ideas and seeing them really push to go to fruition. And that’s where, hopefully, these scorecards can be helpful in disseminating the useful information that will push states forward, and the information can be used to inform effective policy.
Ruby Wincele: Yeah, and I just sent it in the chat, but if you’re on any of the state scorecard pages, and you scroll all the way down, there’s a link that says Download Documentation. So you can see all of the policies that we modeled across these states and how we actually modeled them. So if you want to see in your state, in particular, what policies we were actually able to model and what those translated to in the EPS, feel free to check that out. Because we want everyone to have all the information they need to figure out what’s going on in their state and how to move forward.
Ashna Aggarwal: I also want to flag two states that I think are showing incredible progress. Massachusetts and Maryland are both, you know, they’ve passed some of these foundational policies that Ruby had flagged across the board, for the electricity sector, the transportation sector, the building sector, just really making great progress. And I’m native to Maryland, so just great to see, you know, that pride when you see the state action for your home state, really fun, great progress.
Q: Okay, so last question. What are the next steps for folks reading these scorecards, how can they translate this into action?
Nathan Iyer: I would say that once you’ve identified the sectors or sub sectors that are showing not as much progress as you’d expect — say that’s the building sector, you’re seeing more combustion of natural gas than is aligned with the NDC targets. The next step is to look at the realm of options that targets that specific story. And you can think of every single decarbonization story as distinct in some ways, there are different technologies, different dynamics, different stakeholders that you need to engage. So looking at what has been done across other states is important, and I think the Climate XChange State Climate Policy Dashboard really helps with that information. What are the options that have been imagined, in total, that could target those types of emissions? Then, based on the constituencies that you’ve seen within your state, the decision makers, the place where your state government is, and on top of that, thankfully, some federal incentives that you can apply to those targets, you can pull those together into a cohesive strategy to target that specific sub sector’s emissions. I think folks get overwhelmed if you try to do too many things at once, but take every problem as a specific problem, as a coherent problem, take all the solutions that we are aware of, all of the solutions that we have imagined, and all of the resources that we have available to target that problem, and pull those together into different ideas on how to do advocacy, from state legislatures to PUCs and to other major decision makers in your geography.
Conclusion
RMI partnered with Climate XChange to release State Climate Scorecards analyzing how 20 states are progressing toward climate-aligned targets for 2030. These scorecards show that foundational policies like clean energy standards, renewable portfolio standards, Advanced Clean Cars and Trucks, and building code updates are doing much of the heavy lifting on state-level emissions reductions. For further analysis, the scorecards show sub-sector metrics that can help you understand exactly what areas your state needs to focus on to hit NDC-aligned targets by 2030. Most importantly, we have the state policies and funding to make U.S. climate alignment a reality, and now, it’s up to states to deploy these solutions. As always, collaborating within and across state lines is key to harnessing the existing strength of nationwide climate advocates and getting us across that finish line.
* The views and opinions expressed by our guest speakers during the webinar and summarized in this article are their own and do not necessarily reflect the views or positions of Climate XChange.