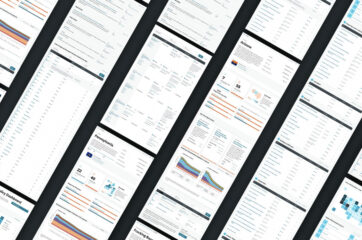
Climate XChange’s new State Climate Policy Dashboard is an all-in-one tool that transforms how advocates and other climate actors research climate policy.
The Dashboard addresses the growing need for an accurate, publicly accessible, and comprehensive source of information on the current state climate policy landscape. Now, it’s easy to compare policies across states or view the complete landscape of policies in a particular state. The Dashboard features in-depth state examples, model legislation, enacted policy text, and other resources to help craft the most effective policies. With information on 62 climate policies for all 50 states, advocates can now find what they’re looking for all in one place.
In this webinar, Ruby Wincele, Policy & Research Manager at Climate XChange, walked us through our new State Climate Policy Dashboard, focusing on how it can be used in practice by policymakers, advocates, and other state actors.
Ruby Wincele, Climate XChange
Why: The Goals of the Dashboard
The Dashboard simplifies research by hosting all climate policy information in one place, as a free and accessible tool for any stakeholder to use.
The Dashboard is:
- Comprehensive: Tracks 62 policies across 50 states and seven climate sectors
- Accurate: Updated twice a year, utilizing manual and ground-truthed policy tracking
- Collaborative: Features resources from over 100 organizations and crowdsourced data from the State Climate Policy Network (SCPN)
While there are resources that track state-level climate policy, emissions data, political information, and model rules spread across the web, the Dashboard is a one-stop shop that spans all states and major climate sectors, aiming to provide any stakeholder with the data they need to inform their policy work.
What: The Data in the Dashboard
The Dashboard tracks 62 climate policies across seven major climate sectors:
Climate Governance and Equity policies focus on how states are establishing the fundamental procedures, definitions, and directives that guide their transition to a clean economy through an equitable and just process. These policies include greenhouse gas (GHG) emissions reduction targets, climate action plans, environmental justice community definitions and investment requirements, and just transition work.
Cross-Sector policies focus on economy-wide emission reductions and often involve market and investment mechanisms or financial components that increase funding for a range of climate solutions. These policies include green banks and carbon pricing.
Electricity policies focus on reducing emissions produced by the generation, transmission, and distribution of electricity. These policies include clean energy standards, renewable portfolio standards, net metering, interconnection standards, and coal phase outs.
Buildings and Efficiency policies focus on mechanisms that decarbonize commercial and residential buildings. These policies include energy codes, building performance standards, energy efficiency resource standards, and weatherization funding.
Transportation policies focus on decarbonizing the movement of goods and people by road, air, rail, or water. These policies include low emission vehicle standards, zero emission vehicle sales requirements, electric vehicle (EV) rebates, EV charging infrastructure requirements, low carbon fuel standards, and vehicle miles traveled (VMT) reduction.
Industry, Materials, and Waste Management policies target the ‘materials economy’, or all activities related to the manufacturing, processing, production, use, and disposal of goods. These policies include Buy Clean standards, oil and gas regulations, fracking bans, methane regulations, and food waste bans.
Natural and Working Lands policies are centered around climate mitigation related to forests, wetlands, farmland, urban green spaces, and the rest of the natural environment. These policies include agricultural financial incentives and technical assistance programs.
The Dashboard’s data is aggregated through various methods, including:
- Quorum, a policy tracking software
- Partnerships with 11 contributor organizations whose policy tracking we directly source from and link out to
- Crowdsourced updates from SCPN members across the country
- Secondary research
To learn more, visit our Dashboard Methodology page.
How: The Features of the Dashboard
The State Climate Policy Dashboard has a whole host of new features — many of which originated from feedback from the first version of the platform.
Identify state-specific policy opportunities
The Dashboard tracks policy occurrence across all 50 states, with four different policy statuses:
- Enacted policies have been passed or established in a state by a governing body via legislation, executive orders, rules, regulations, and/or other program creation, and remain in effect.
- In progress policies have been established in a state, but final regulations, rules, or plans are pending final approval. This also includes legislation and executive orders that require regulations to be put into effect.
- Partially enacted policies have been enacted in the state, but are missing one or more policy components. Dashboard policies cannot be considered partially enacted unless policy components are available.
- Not enacted policies have not been passed or established in the state or are no longer in effect.
To learn more about the terminology used on the Dashboard, visit our Glossary.
For every policy enacted, in progress, or partially enacted, we include the policy summary, establishing policy, and year enacted, as well as links to the bill, regulation, or other official relevant documents. On our State pages, we also contextualize the climate landscape with information on each state’s political profile and notable other climate factors.
Visualize state greenhouse gas emissions and projections
The Dashboard features state-specific emissions inventories and projections through 2050, using data from the Energy Policy Simulator (EPS), a product of RMI and Energy Innovation. The EPS utilizes emissions data for the 48 contiguous U.S. states and allows users to model the impacts of various climate and energy policies. While the current version of the Dashboard only includes emissions projections under a business as usual scenario, we are working to visualize emissions projections under an additional scenario where key policy opportunities are enacted in the state.
Compare policies across states and sectors
Dashboard users have the ability to sort and filter policies by status, year enacted, and sector; compare similar policies across states; and explore an entire state’s climate policy landscape. With our new State Comparison Tool, you can select up to four states and compare progress across any sector or for individual policies. For any policy you select, we’ve included model states as strong examples with notable design features for other states to consider.
Explore establishing policies, model rules, state examples, and key policy resources
The Dashboard’s Policy pages include model policy text, as enacted in states or as template language, as well as policy-specific reports, maps, databases, guidebooks, and other resources from over 100 featured climate policy organizations. For every policy, the Dashboard also features a 50-state map to view the status of that policy in each state.
Request technical assistance from Climate XChange
The Dashboard also makes it easy to access pro bono assistance from Climate XChange staff through our Request Policy Assistance button. We have in-house policy expertise to support your campaign, and we can also connect you with relevant technical experts and advocates from the SCPN working on similar issues.
View a walkthrough of the Dashboard from our screenshared segment of the webinar.
Q&A
Q: How did you select the 62 policies you track, and is there a plan to add more policies? Is there a way for people to suggest other topic areas relevant to climate policy?
Ruby Wincele: We went through a robust process to develop this framework. It started with, first, compiling a list of every climate policy we could think of. It didn’t need to fall into a specific policy area or a certain topic, we wanted to cover our bases with as much as possible. From there, we did a lot of research on the landscape of those policies, and what they look like across states. Is it feasible for all states to work on this policy? Is it broadly applicable? Does it exist anywhere? We do have a handful of policies that are newer, not many states have them, but for all policies on the Dashboard, at least one state needs to have that policy enacted.
From there, we re-evaluated our existing framework, which had around 65 policies, but we readjusted the framework. Climate XChange is a mitigation-focused organization, so we decided to shift away from adaptation and resilience, which was included in the old framework. There’s a ton of great resources and organizations working on adaptation and resilience. If you are interested, the Georgetown Climate Center’s Adaptation Clearinghouse is a great resource; they have a lot of the same information, like policy updates and resources, specifically on those topics.
So we looked at this list, looked at the landscape across states — we did want to include as many policies from our old Dashboard into the new one if it fell within scope. Then from there, we assessed what the top policies were that were missing from the existing framework. So basically, we assessed the landscape and the relative importance and impact of a lot of these policies. And in terms of adding new policies, we have a list of 40 or 50 potential additions right now, and that’s without opening the floor to all of you to see what other policies you’re interested in. So if you do have ideas, you can go to that feedback form on the website. You can email me or Kristen with those ideas, because we want to make this robust, comprehensive, and really useful for all of you.
Q: Who are the model rules developed by, and how were model states chosen?
RW: Most model laws come from Legal Pathways for Deep Decarbonization; their website is lpdd.org. They develop model laws with a network of lawyers, which are peer reviewed and create template policies where you’re able to plug in state-specific information. For example, they have one for clean energy standards, where you’re able to set specific years and targets, I believe, and plug in state-specific information. So they have a really robust list of model laws. They have a ton more that we don’t feature on the Dashboard, just because we don’t currently track those policies. But it’s a great resource, and I recommend checking that out.
There are some from other organizations that are more topic- or policy-specific, such as interconnection standards or community choice aggregation. We crowdsource information from other organizations who are really experts in the space. In terms of model policies and states, a lot of that was conducted in house, doing a really thorough investigation of these policies, and we’re open to feedback on that as well. Using the dashboard data and our knowledge, we highlighted exemplary states or exemplary aspects of a certain policy.
Q: What are partially enacted policies, and what are policy components?
RW: I can pull one up and screen share, back on the comparison tool. Right now, we have policies with components across electricity, buildings, and transportation. As you can see, if you’re on a Policy Area page or the All Policies page, you can see really quickly which policies have components.
I’ll highlight net metering because it’s a bit of a unique example. So, you might be alarmed and saying, oh wow, no states have net metering right now. That’s only because the policies are broken down into components, and I’ll click on that right now. This is a policy where we incorporate SPOT for Clean Energy’s policy components and data. They’re another great organization, they have a ton of great resources and in depth policy components. So here you can see that no state has all policy components fulfilled. They’re all this striped shade or not enacted. So in 45 states, they’re partially enacted, meaning they have some components fulfilled, but not all. Net metering is another unique example on the Dashboard — SPOT has two net metering policies, and we lump them into one, so that’s another main reason why it’s saying zero states have the policy enacted. Some might fulfill all components of one policy or the other, but not both. Net metering is also a unique example, it’s 11 components combining the two policies, but most other policies will have between four and six components.
Key resources are right here, we link right out to SPOT’s net metering and aggregate net metering policies for specific states. And so you can see, a lot of states are really close to having that enacted, but are missing just one specific component. You can hover over the bars to see what component that is. And so all of these states have 10 out of 11 components. California, for example, and Pennsylvania, do have all five or six components of one policy, but not the other. So it’s breaking down the policies into more specific aspects — so not only just, does it exist, but other aspects, like are all eligible resources in net metering? Are they eligible for aggregate net metering? Is it capped? Does it apply to all types of utilities? So, it’s trying to get more at evaluating quality and progress.
I can also show one where there are states with that policy fully enacted, so weatherization funding, there’s a lot more variety in the map. Even though there are still 44 states with it partially enacted, there are five states with all four components fulfilled. Here are the components, again, pulled from SPOT for Clean Energy’s website, and you can see that some model states do have all components fulfilled. So that means it’s no longer partially enacted, it is enacted for the status, and we link out to the state specific pages for the policy as well. Here you can see there’s a lot of variety, even though most states are partially enacted, there’s a lot of variation in what components of the four they have enacted.
Q: How do you see the Dashboard being used to enact change? Who are your target audiences, and how can the Dashboard be used for further climate policy progress?
Kristen Soares: I think it’s a really, really useful tool for states, for folks that are working on developing legislation, executive orders, regulations and things like that, to see what other states have done, especially states with similar policy context to them. That’s why we have those summary blurbs and political context at the top of every state page. I always say at the SCPN, someone somewhere has done what you’re trying to do. And I think the Dashboard really helps you get exactly to, what is the policy that I’m trying to craft look like in other states? What does my state’s climate policy landscape look like? And where are there places where we can push for further change?
I think also, especially for policies with components or in progress, those are policies to keep an eye on, in terms of where the state is going. And then I think it’s a really powerful tool for communication, especially with elections coming up, but also just in general. To show those maps with a snapshot of what the country looks like with different sorts of climate policies, or what your state looks like with different sorts of climate policies. I think it’s a really useful and easy to use tool for folks that aren’t necessarily in the weeds of climate policy every day. So a lot about accessibility and data democratization, but I’ll hand it over to you, Ruby.
RW: Just to follow up a little bit more, we’ve had the old Dashboard used by all different types of actors: researchers, legislators, people working in the executive branch, advocates, national NGOs, all of that, and so we see that trend continuing. I think there’s a lot of different use cases. Like Kristen said, a main one is just being able to understand your state’s context, and then also see how that varies, maybe by region, maybe by similar energy profiles, similar policy progress, all of that, and bringing in climate policy design and ideas from other states into your state.
So that’s something we’ve done through the policy assistance program as well, using our knowledge of policy across all 50 states to craft policy and bills before. But, I think it’s a really powerful tool to understand where your state is currently at and where there’s an opportunity to make more progress. Another feature that only lives on Arizona’s page right now is identifying key policy opportunities, and so, just being able to have the work done of identifying what are the most impactful policies in your state that can either make existing policies more ambitious, or if your state doesn’t have much on the books, being able to identify where the hardest hitting most impactful policies are.