The State Climate Policy Network Transmission Series
After years of ambitious campaigns to set climate and clean energy targets at local, state, and national levels, it’s become clear that our country’s current power grid cannot keep up. Integrating new renewable energy sources, as well as meeting rising energy demand and ensuring affordable electricity service, requires a massive expansion of the quantity and quality of transmission lines across the nation — by some estimates, we need to more than double our existing transmission capacity.
Transmission reform requires coordination between federal, regional, state, and local governments, as well as partnerships between traditional transmission actors and the larger climate movement. To meet this challenge, the State Climate Policy Network is hosting a series of transmission-focused events, including introductory webinars on the basics of transmission, expert panels diving into various specific aspects of climate-aligned transmission reform, discussion-based forums on transmission developments across the country, and opportunities to connect with transmission experts and advocates.
Events
Watch Our Webinar Series
Webinar Recap: Connecting the Dots Between Grid Investments and Energy Affordability
Investing in our energy grid secures reliable, resilient electricity and saves money in the long run. However, state policies working to accelerate these investments — including modernizing our transmission grid or expanding it to connect to new clean energy resources...
Webinar Recap: State Engagement with Regional Transmission Processes, A MISO Case Study
States must prioritize transmission modernization and expansion to ensure a reliable, affordable, and resilient energy future, but much of the transmission grid is regulated at the regional and federal levels. It’s important that states are able to engage with other...
Webinar Recap: Powering Change — The Role States Can Play in Transmission Reform
This webinar is part of our new transmission series, where we provide climate policy actors with the knowledge and tools they need to bring transmission advocacy into their work. For more information on how transmission policy can provide reliable and...
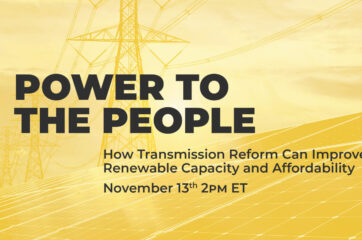
Webinar Recap: Power to the People — How Transmission Reform Can Improve Renewable Capacity and Affordability
As clean energy sources are increasingly added to the grid and energy demand rises, the transmission systems that carry electricity from where it’s generated to where it’s used must be transformed. A modernized and expanded grid not only ensures we...
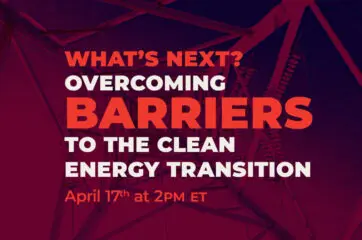
Webinar Recap: Overcoming Barriers to the Clean Energy Transition
After years of ambitious campaigns to set clean energy targets and pass enabling policies across the country, the focus is now expanding to how and when these much-needed investments will take place. Transforming the power grid can be slow and...
Read More About Grid and Utility Reform
Policy Explainer: How States Can Expand Consumer Power Choices
Climate XChange’s Dashboard Digest is a deep dive on each of the policies that we track in the State Climate Policy Dashboard and an exploration of how these policies can interact with one another to form a robust policy landscape....
Policy Explainer: What States Can Do to Modernize the Grid
Climate XChange’s Dashboard Digest is a deep dive on each of the policies that we track in the State Climate Policy Dashboard and an exploration of how these policies can interact with one another to form a robust policy landscape....
Policy Explainer: Fast-Tracking Renewables with Interconnection Standards
Climate XChange’s Dashboard Digest is a deep dive on each of the policies that we track in the State Climate Policy Dashboard and an exploration of how these policies can interact with one another to form a robust policy landscape....
Policy Explainer: How Utility Reform Can Align Profits with Climate Goals
Climate XChange’s Dashboard Digest is a deep dive on each of the policies that we track in the State Climate Policy Dashboard and an exploration of how these policies can interact with one another to form a robust policy landscape....
Policy Explainer: Designing a Roadmap for Decarbonization with Clean Energy Plans
Climate XChange’s Dashboard Digest is a deep dive on each of the policies that we track in the State Climate Policy Dashboard and an exploration of how these policies can interact with one another to form a robust policy landscape....
Policy Primer: The Grid Isn’t Broken, But Still Needs Fixing
Climate XChange’s Dashboard Digest is a deep dive on each of the policies that we track in the State Climate Policy Dashboard and an exploration of how these policies can interact with one another to form a robust policy landscape....

