Climate XChange Staff

Policy Explainer: How States Can Cut Methane Emissions Through Food Waste Bans and Targets
Climate XChange’s Dashboard Digest is a deep dive on each of the policies that we track in the State Climate Policy Dashboard and an exploration of how these policies can interact with one another to form a robust policy landscape....
Introducing the New State Climate Policy Dashboard
Three years ago, we launched the State Climate Policy Dashboard to meet the need for an accurate, publicly-accessible, and comprehensive database on the current landscape of state-level climate policy. Since then, the Dashboard has helped climate actors across the country...

Policy Explainer: Drilling Down on State Efforts to Ban Fracking
Climate XChange’s Dashboard Digest is a deep dive on each of the policies that we track in the State Climate Policy Dashboard and an exploration of how these policies can interact with one another to form a robust policy landscape....
Key Takeaways from the EPA’s Implementation Grant Announcement
This week, the U.S. Environmental Protection Agency (EPA) announced the state, local, and Tribal* recipients for Implementation Grants from the Climate Pollution Reduction Grant (CPRG) program established in the Inflation Reduction Act. In total, the recipients were awarded more than...

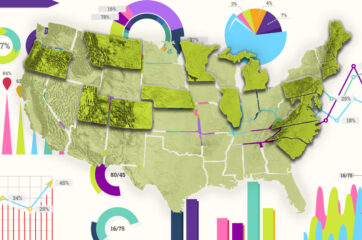
State Priority Climate Action Plans Assessment Spreadsheet
Climate XChange, Evergreen Collaborative, and RMI reviewed 47 climate plans from 45 states, Puerto Rico, and the District of Columbia that were submitted to the U.S. EPA as part of the Climate Pollution Reduction Grants (CPRG) program. This program, a...

Policy Explainer: Reducing SF6 Emissions through Power Sector Regulations
Climate XChange’s Dashboard Digest is a deep dive on each of the policies that we track in the State Climate Policy Dashboard and an exploration of how these policies can interact with one another to form a robust policy landscape....
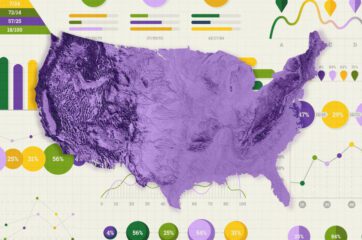
We Read 6,795 Pages of State Climate Plans. Here’s a First Look at What We Found.
Almost every state has stood up to take action on the latest IRA opportunity. Here are the numbers documenting their climate ambition. Millions of dollars are about to flow to states to help them tackle their unique local climate challenges. The...
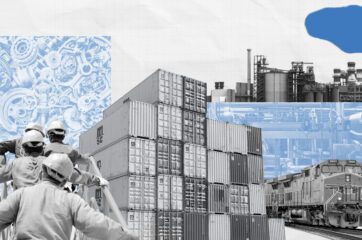
Policy Primer: Reframing How We Think About Industrial Emissions
Climate XChange’s Dashboard Digest is a deep dive on each of the policies that we track in the State Climate Policy Dashboard and an exploration of how these policies can interact with one another to form a robust policy landscape....

2023 State Climate Progress: Our Full List of Enacted Policies and Trends
The Policy Progress section of our biweekly newsletter shares newly enacted state climate policies, including legislation and executive branch regulations. Below is an archive of our Policy Progress updates from 2023 and four trends we’ve seen from the policies states...