This article is part 5 in a series on carbon pricing, environmental justice, and California’s cap-and-trade program. Check out our other articles in the series:
Addressing Community Needs through Smart Climate Policy (9/27/19)
Clearing the Air: Local Pollution as a Social Justice Issue (10/4/19)
California’s Example of What the Green New Deal Could Look Like (10/10/2019)
The (Other) Problem With Offsets in California (10/18/2019)
Check out CXC’s full report, Carbon Pricing in a Just Transition.
If you were given billions of dollars to invest in your state’s green transition, how would you invest it in a way that ensures benefits for communities that need it most?
The coming decade will be a pivotal time for addressing the climate crisis, with experts urging the need to cut greenhouse gas emissions in half by 2030. In parallel to this seemingly daunting task, we continue to suffer from a failing transportation system, a housing crisis, broad health and wealth inequality, deficient food and water systems, and much more. In order to tackle these major challenges, we need more than just bold political leadership – we need new cash flows and resources to implement this kind of transformative change.
Carbon pollution pricing has the potential to provide substantial revenue to fund the diverse solutions needed for a rapid transition to a clean and sustainable economy. Since 2012, California’s cap-and-trade program has raised over $12 billion for such investments, even with carbon prices remaining relatively low. Increasing existing carbon prices and expanding to new jurisdictions can rapidly unlock trillions of dollars of private and public capital to mobilize the sustainable transition across the globe.
However, raising the revenue itself is only half the battle. The crucial second challenge is how to use this revenue in order to build an inclusive, equitable, and sustainable economy. Low-income communities and communities of color are already disproportionately bearing the worst impacts of pollution, and have insufficient political representation and resources to address them. New government structures and processes need to be set up in order to comprehensively address environmental and social injustice.
We need new legislation, modern tools, and comprehensive data practices – carbon pricing initiatives are an integral part of the toolkit necessary, and are a promising opportunity to improve our environmental justice practices as well.
Making equity the law
Since 2012, California’s cap-and-trade program has raised over $12 billion to invest in the green transition, with the legislature taking a large role in how investment is directed and used. SB 535 and AB 1550, passed in 2012 and 2016 respectively, require that at least 25% of cap-and-trade investments be directly located in and benefit “disadvantaged communities”, and another 10% must take place in and benefit low-income communities.
What exactly is a disadvantaged community? California’s Environmental Protection Agency (CalEPA) was charged with answering that question, and did so through a public and transparent process with extensive data on socioeconomic and environmental factors across the state.
The result was CalEnviroScreen – an open tool that scores each census tract according to measures of pollution exposure, environmental effects, health sensitivities, and socioeconomic factors.
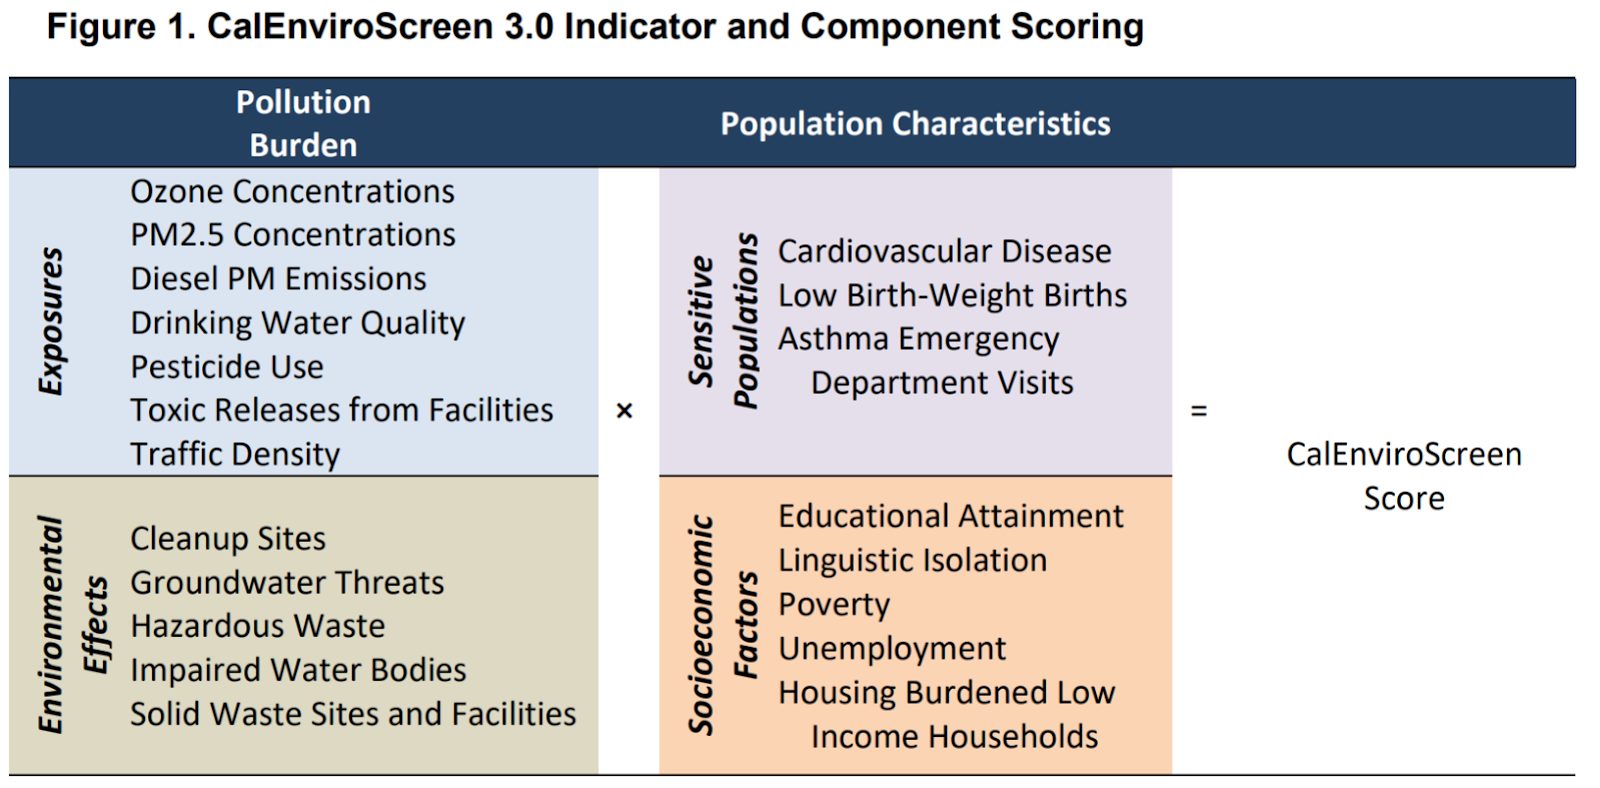
CalEnviroScreen 3.0 Indicators and Component Scoring
These criteria are combined into a number score for each census tract, allowing the CalEPA to designate the top 25% scoring communities as disadvantaged, for the purpose of cap-and-trade investments.
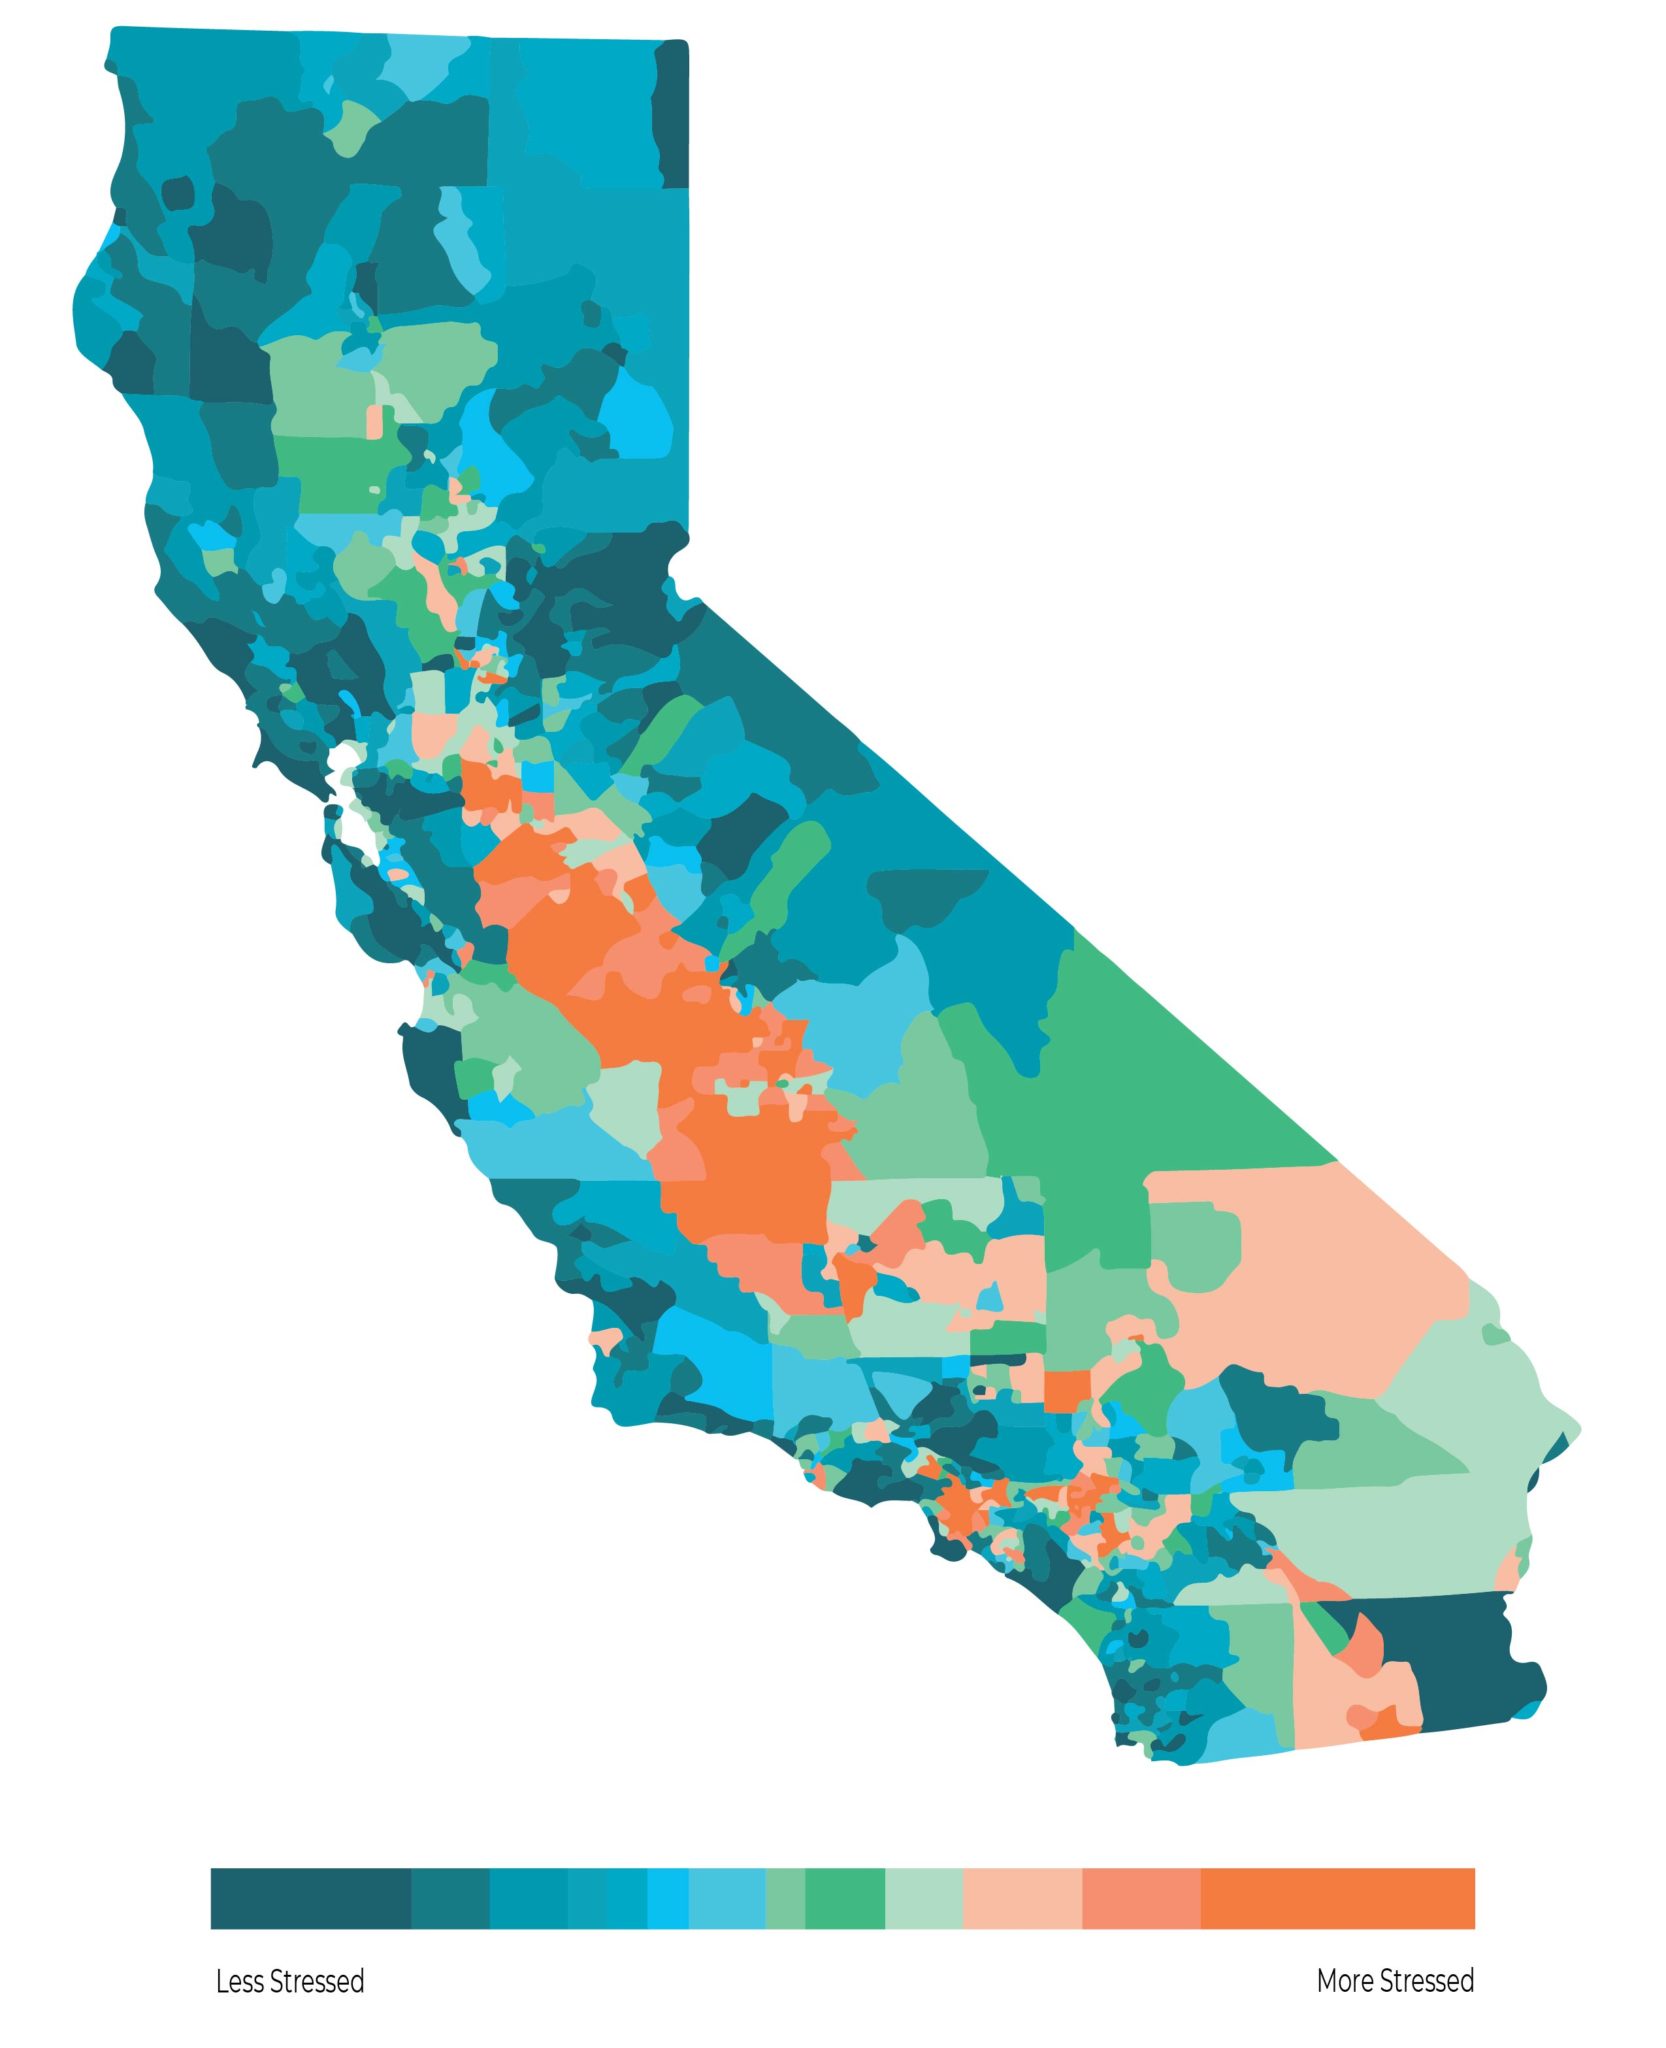
California census tracts by CalEnviroScreen score.
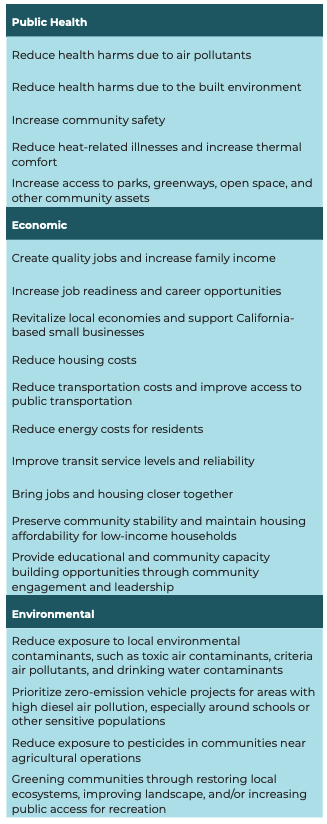
With disadvantaged communities identified, it is then up to California Air Resources Board (CARB) and other agencies to prove how their investment projects provide actual, measurable benefits to these communities. To assist in this task, CARB has authored extensive guidelines that outline three major steps that every potential investment has to undergo before receiving funding:
Step 1: Identify the community. Every project must identify exactly what communities the program will benefit, or the program’s ability to benefit low-income households, using CalEnviroScreen and low-income calculators created by CARB.
Step 2: Identify a community need. Agencies have to demonstrate how their project meaningfully addresses an important community or household need. This includes direct engagement with the community, and documented broad support from residents and/or community groups.
Step 3: Provide a measurable benefit. Finally, the agency in charge of the potential investment must identify at least one direct, meaningful, and assured benefit according to community needs.
Potential benefits of California Climate Investments
Estimates by California’s agencies have found that investments into disadvantaged and low-income communities have greatly exceeded what the law requires. Since August 2017, 39% of investments have been located in and benefited disadvantaged communities, and an additional 21% of investments have been located in and benefited low-income communities (see the outside ring of the chart below). By comparison, current law requires that at least 25% of investments are located in and benefit disadvantaged communities, and that an additional 10% is located in and benefiting low-income communities (see the inside ring of the chart below).
California Climate Investments Since August 2017 (AB 1550)
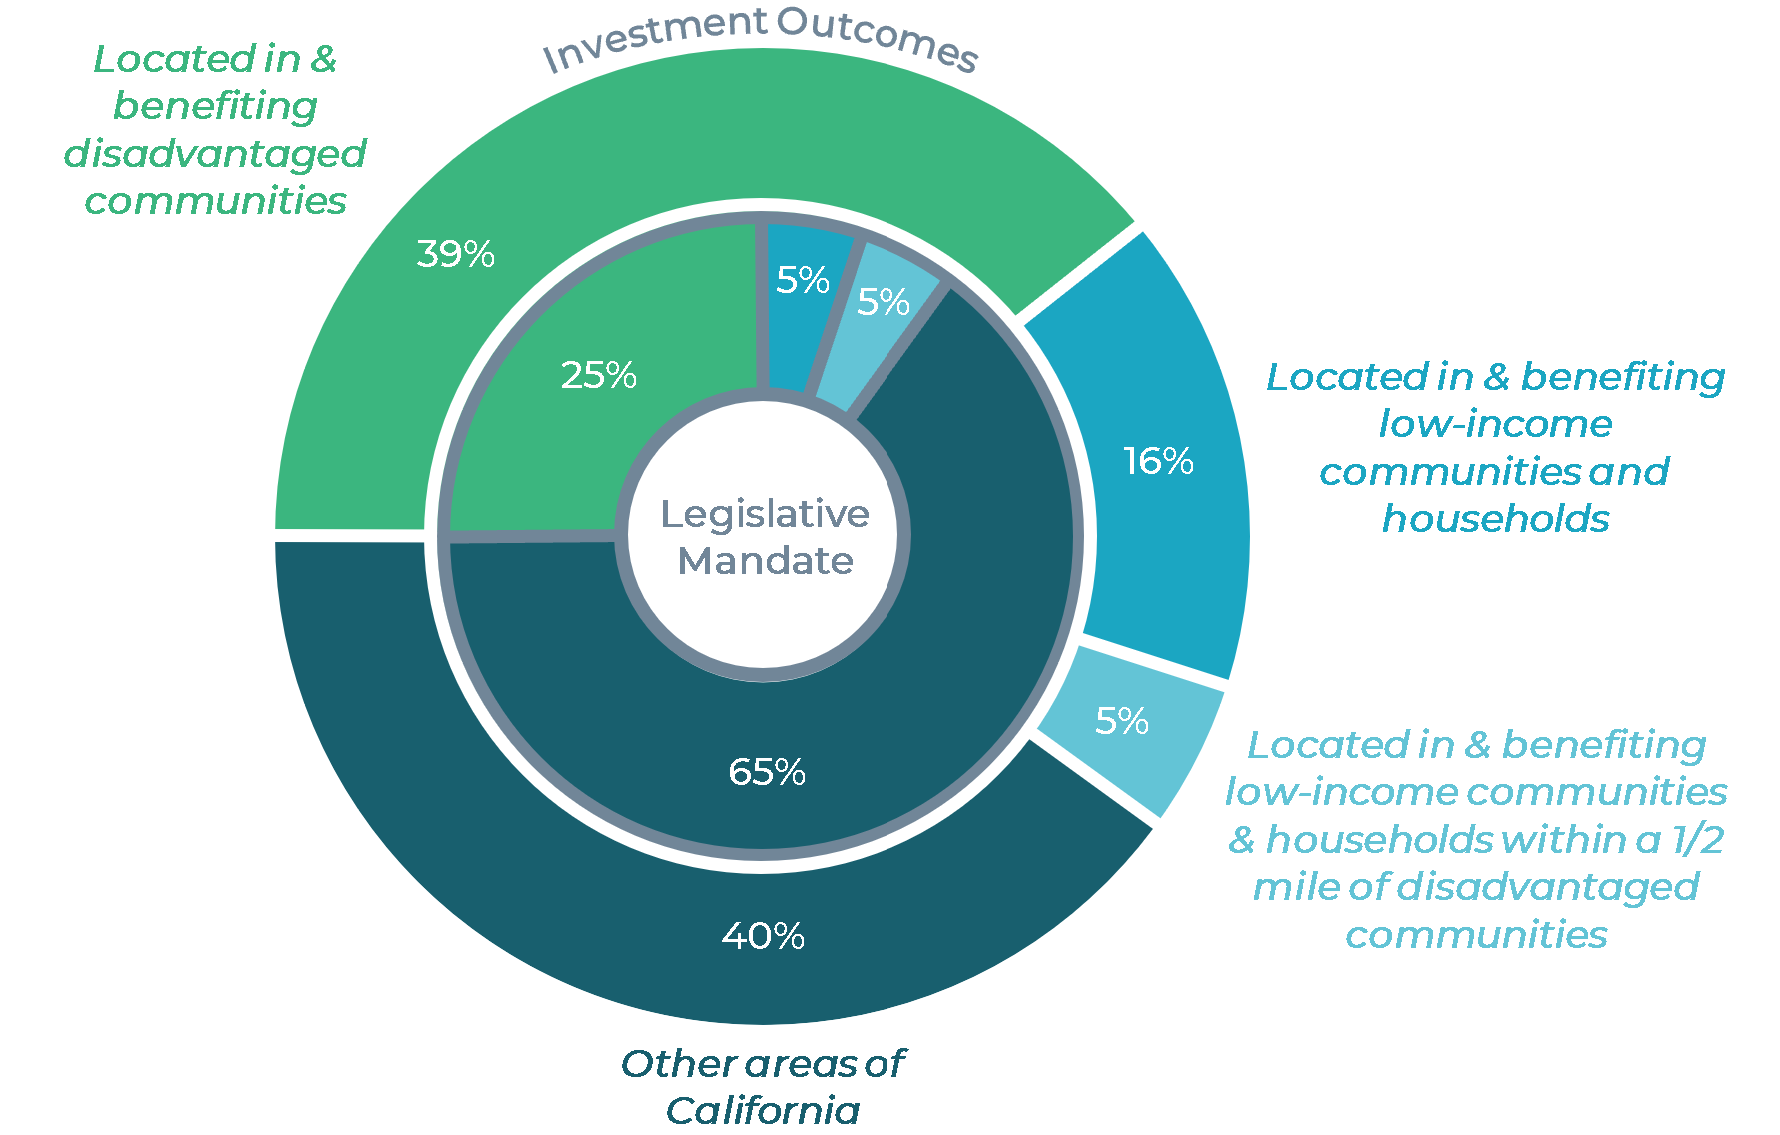
The inner circle represent those percentages mandated by legislation, while the outer circle represents percentages achieved in practice, according to California’s annual investment report.
This could mean one of two things – either future equity percentage requirements can be much higher, or what agencies constitute as a “benefit” to these communities is too relaxed or includes benefits to surrounding communities. For example, if a community is facing adverse health impacts from a nearby manufacturing facility, then adding a new bus line will not solve the community’s health issues. A majority of California’s cap-and-trade funds are directed towards large infrastructural projects, such as high-speed rail and other public transit, where agencies may still be just checking off the boxes when it comes to engaging, identifying, and addressing community needs. Not every benefit is created the same, and current California investment process doesn’t provide enough data to differentiate between what is truly beneficial and what is superficial.
Nonetheless, the exercise of using such data practices to designate and prioritize environmental justice communities is woefully missing from many states’ climate plans. In the meantime, the US Environmental Protection Agency offers EJSCREEN, a similar tool to CalEnviroScreen that maps data across all US states, which could be a good start for those unable to recreate the successes of California’s state-catered tool.
Executing on these processes is hard work, and other states don’t have California’s administrative capacity. However, it takes only a small portion of carbon pricing revenue to do this the right way. Through 2018, California reports that cumulative program administration costs are less than 3.5% of total public spending on California Climate Investments.
Ultimately, the best results happen when communities are given the resources and power to solve environmental injustices endogenously, This requires dense place-based initiatives and new ground-up governance structures. Addressing the deep and systemic environmental injustice present in our communities will take far more resources and investment funds than currently available, even in a place like California.
But there are still basic processes that all states need to replicate and follow from California’s experience, primarily in modernizing their approach to environmental justice. CalEnviroScreen was created for the purpose of cap-and-trade investments, but has since been integrated across countless other programs in the state to improve equity outcomes. As carbon pricing initiatives emerge in new states, they offer a vital opportunity to update environmental justice data practices as well.
This includes comprehensive exercises in mapping disadvantaged communities, creating extensive funding guidelines for providing benefits, and using the latest research to measure, assess, and celebrate these benefits over time.